
There haven’t been many macroeconomic topics on top of investors, economists, and analysts’ minds in 2021 than inflation. After more than a decade of minimal inflation documented within the CPI and PCE indices commentary about rising prices was revived, even if most people bought into the “transitory” narrative. A post this spring documented some preliminary thoughts I had about the underlying dynamics driving inflation along with possible ramifications for equity markets. Inflation data since then has come in slightly hooter than the expectations laid out in that piece with year over year pricing up at the highest rates since the mid-2000s. Equity markets have largely taken the data in stride with all large-cap indices up slightly since then and Small Caps and Mid Cap companies only down a few percent thanks to trading the last couple of days.
The bond market on the other hand has had quite a different trading pattern. It’d be rational to think that the fixed income market would be the one most impacted (in a negative way) by inflation data surprising to the upside. Further, the Fed’s June meeting indicated that, compared to months prior, more members of the FOMC were seeing rate hikes and an end to emergency asset purchases sooner. This slightly hawkish news, albeit marginal and some time away, would have had most onlookers guessing we’d be in store for a violent move in rates to the upside. We got quite the opposite however (Figure 1).
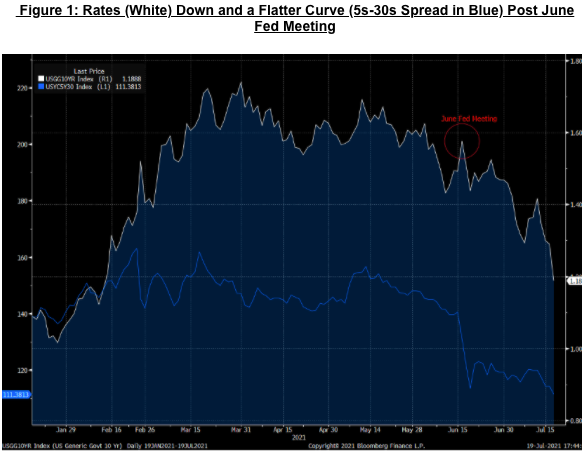
Instead, rates are at their lowest since the very early parts of this year. So what explains a drastic rate move in the complete opposite direction than conventional wisdom would suggest?
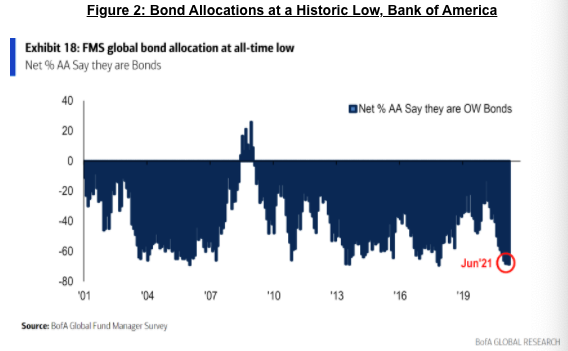
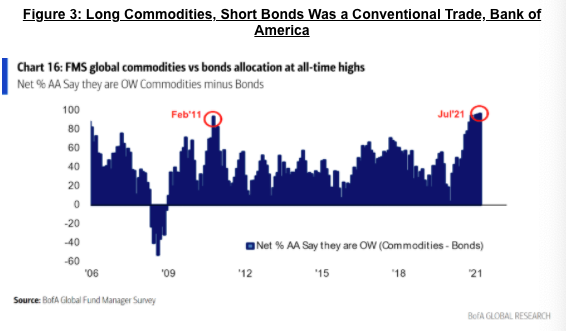
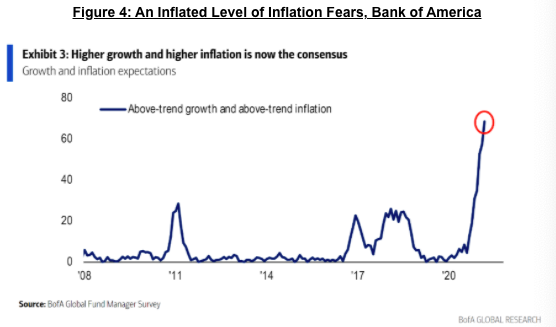
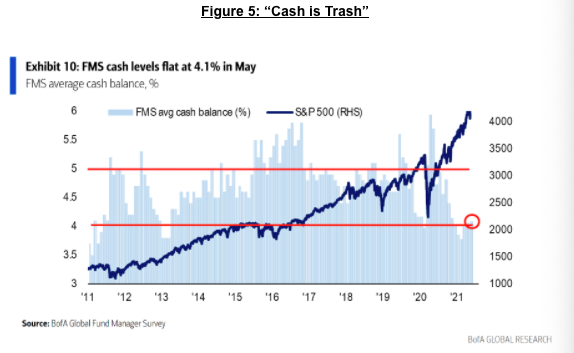
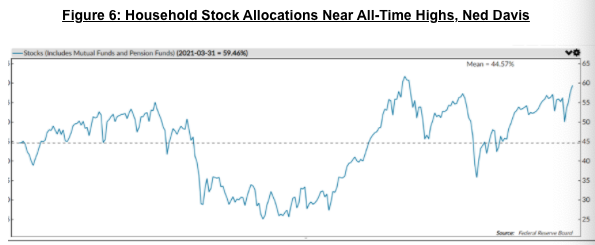
I think the first culprit explaining it is how investors have been positioned for the majority of 2021. Going into that Fed meeting it seems pretty clear to me that just about everyone was on one side of the boat. A June survey of Fund Managers by Bank of America revealed that allocations to bonds was at an all-time low (Figure 2). Everyone was of the view that higher and higher inflation was coming and was playing it via going long commodities and shorting bonds (Figures 3 and 4). As a result, investors bought into the mantra that “cash is trash” as cash balances hit their lowest levels since 2011 (Figure 5). The only time in the last 70 years in which US Households had a greater allocation to stocks was in the peak of the Dot-Com Bubble (Figure 6) and bears are nowhere to be found.
When everyone is on one side boats usually tip over and people get washed out. When no one is bearish then the market has a funny way of creating them via correcting the price. That’s certainly been the case for the bond market over the last month. Whether or not it bleeds into the equity market remains to be seen.
While the positioning data is quite insightful and, in my opinion is presently sufficient for explaining the move in rates, others are not as convinced. Rather, they taking the message from the bond market that inflation is indeed transitory and that, at the very least, the Fed is not asleep at the wheel when it comes to inflationary pressure, giving them full confidence and credit in the ability for the central bank to contain rising prices if they remain firm. Others, however, fear that the bond market is warning of some dire growth projections. They point to the peak in the ISM indicator in the spring as well as the fact that Q2 will likely mark the peak growth rate for both earnings and GDP.
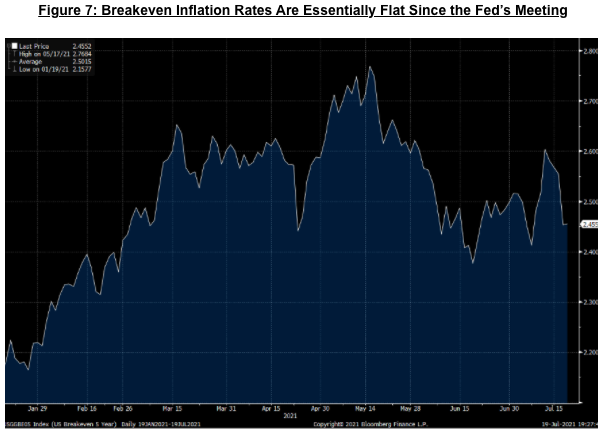
I’m not quite ready to buy into those explanations. First, notice that breakeven inflation expectations over the next 5 years (calculated as the difference in rates between a 5-year inflation protected bond and one of the same tenor without protection) have not budged much at all. It’s nowhere close to the 40bps move we’ve seen in the 10-Year since mid-June. In fact, they are almost exactly at the same level as before the Fed’s meeting (Figure 7).
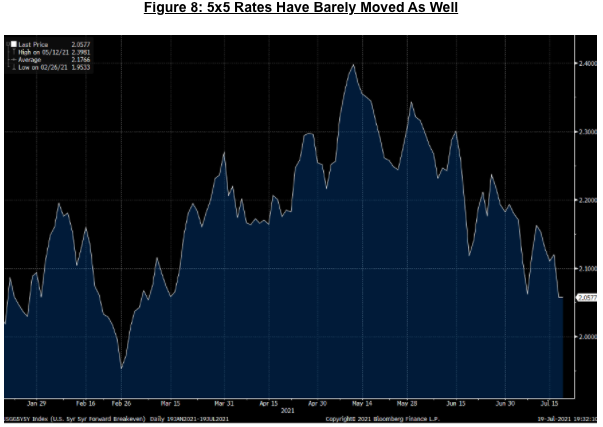
Looking out a bit further the 5×5 year rates (which measure the average expected inflation rate over 5 years starting in 5 years) have only come down by about 14bps since then. Again, not much of a move at all. Sure, they have come down a bit more substantially from the May peak but given that so many prognosticators are worrying about the Fed losing control isn’t the latest move encouraging rather than fear inducing?
If the unwinding of consensus positioning can contribute to the move in rates that we’re currently witnessing, then we need to ask if there are fundamental reasons available that would explain a potential reversal. After all, positioning is always subject to changes and it wouldn’t surprise me in the slightest if after a washout in sentiment that rates renew their march higher.
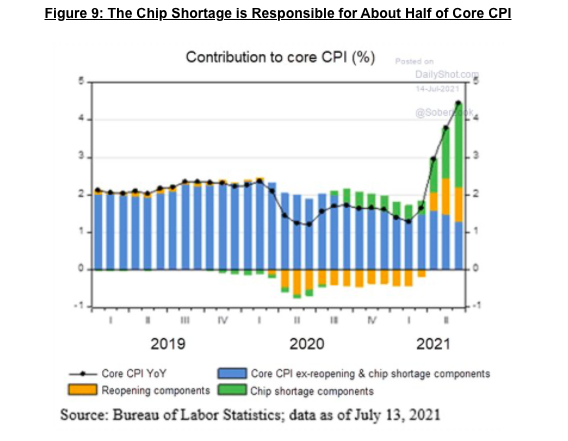
The supply side of the inflation equation will probably get better over the course of 2021 and into 2022; this is probably where most evidence that inflation is indeed transitory lies. Union Pacific, one of the country’s largest railroad operators, paused service for a full week on all traffic from the West Coast in an effort to alleviate traffic congestion. Ports, railyards, and other parts of the transportation system have been notable bottlenecks in alleviating supply shortages. Taiwan Semiconductor noted on its earnings call last week that auto manufacturers should be seeing relief in components this month due to its reallocation of capacity. The chip shortage is estimated to be contributing 2% to Core CPI in recent reports (Figure 9). Lumber pricing has collapsed over the last month as sawmill production is finally picking up.
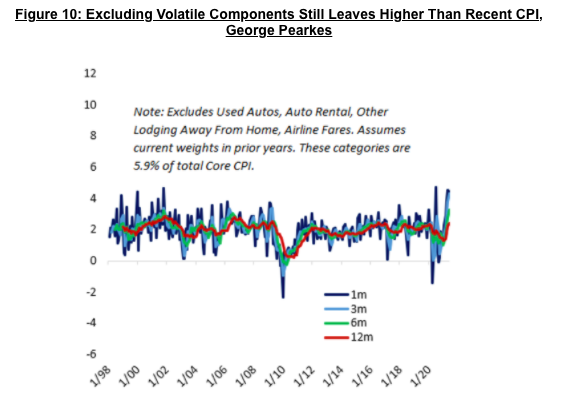
While encouraging, the supply side seems like it will be overwhelmed by demand unlocked by COVID and the general economic recovery. For one, excluding the volatile components that are seeing impact from the supply shortages (like autos) still leaves us at an annualized CPI of over 4% (Figure 10).
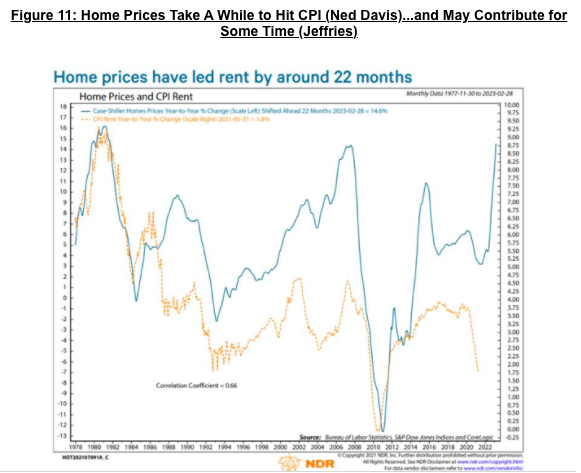
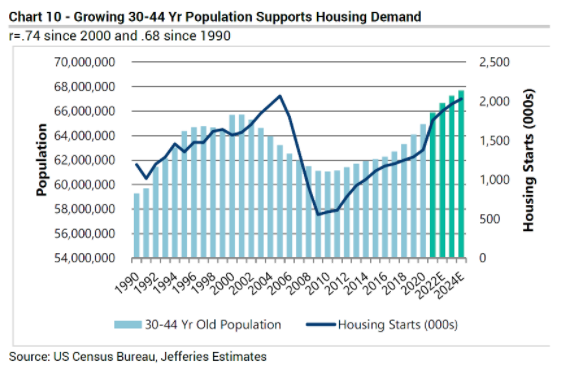
Second, the largest component of CPI (shelter), operates on a very long lag of between 1 and 2 years. Ned Davis has estimated a roughly 22-month lag period for home prices (which do not get counted in CPI) to bleed over into rent and the CPI’s shelter component. But not only do we have a pretty long lag in housing, we also have the ingredients for a sustained increase in demand going forward. For year, economists have lamented the slow pace of household formation in the wake of the Financial Crisis. COVID may have unlocked that demand for good. Jeffries estimates that the market is short 2.5 million homes at a time in which the 28-34 year age segment is now the largest in the country by a considerable margin. While the pace from 2020 may slow, it’s not unreasonable to expect strong demand in the housing sector for the next several years. More importantly, housing demand that comes from increased household formation speaks to strength for the broader macroeconomy, especially since servicing a mortgage relative to income is half the cost compared to the housing bubble of the mid-2000s..
Further, and probably most importantly, we still have roughly 7 million people that are not in the labor market currently that were before COVID shut down the economy. Historically, it takes 2-3 years to recover all the jobs of a recession and sometimes longer. Whether they rejoin the labor market in 2021 or in 2022 adding that many people back to the workforce acts its own form of stimulus by adding greater demand into the economy.
If all this comes to pass (and it’s best to take any forecast about the future lightly) then I can’t help but think that the 1.5% growth expectations for Q4 2022 are too low (Figure 12). If people really do think inflation is permanent, then my guess is they need to revise these expectations up. And thus you have the ingredients for at least some resumed rise in rates over the intermediate term.
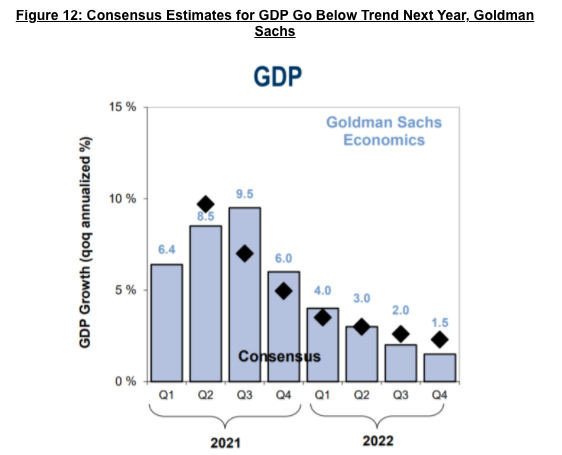
All in all, I can’t help but think that the present move in rates is something temporary. The ingredients are in place for it to remain this low for a while and maybe even go lower until positioning becomes more balanced. The ingredients are also there for it to resume higher, in a way that I don’t think is presently priced into expectations given how quickly a slowdown is projected in Figure 12.
I think this path for rates and inflation is important to point out (albeit it is just one of many possible future paths) because the cacophony of discourse over inflation strikes me as far too short sighted. Just last week I heard a well-regarded analyst complain that the Fed had changed the meaning of transitory from 2-3 months to 6-9 months and then making an Armageddon type forecast. I can’t help but roll my eyes at commentary like this. If the fate of the US dollar or the US economy rests upon a ~6 month extension in inflation levels that we’ve dealt with as recent as a couple decades ago then God help us all. I don’t think it’s particularly difficult to hold the view that the policy reaction (especially one this size) to a once a century pandemic as lasting longer than a calendar year. If a centennial biological Black Swan can’t open someone’s imagination as to what constitutes short-term phenomenon and what doesn’t then we’ve got other problems. Two to three years in the context of what we’ve seen the last 18 months seems perfectly transitory to me, especially if inflation really does settle in the high 2% or low 3% range. Like most things, the devil is in the details.
Ultimately, this backdrop may very well be a situation in which time will offer us a different explanation than anything printed above. After all, rates declined from ~2% to 1.50% within a month in January 2020, long before the equity market caught on to the exogenous shock that COVID represented. So, we cannot rule out that the bond market is discounting something exogenous here as well; but that goes for all time periods and all rate and economic regimes.
Of course, this is entirely divorced from any discussion on valuations and whether deploying capital is prudent. Personally, I’m skeptical but the best advice as they say is to have “strong opinions, weakly held.”