
There are a number of variables, factors, and principles that overlap between both Microeconomics and Macroeconomics: interest rates, wages, investment, taxation, among many others. Millions of students around the world will explore these ideas and drivers as they begin school around this time of year. Yet I would wager that the vast majority of them will not get thorough instruction in the relationship between Corporate Profits and Government Deficits.
I know I myself didn’t. It’s understandable why the oversight exists. From a micro perspective, Revenues – Expenses = Profits and how each of those components manifest and evolve is the primary endeavor of the class. Rarely, if ever, does a sovereign’s fiscal policy enter the discussion. But the two, corporate profits and government deficits, are far more connected than most people realize. Given where things currently stand, both in the macroeconomy at large as well as in the capital markets, I personally am finding it more and more crucial to remember how they are linked and what it spells for us going forward.
An individual has three basic choice when it comes to what to do with their income: Consume, Save, and Withhold. The difference between the latter two is important to point out. For the former, saving can occur while parting with money. For instance, using funds to build a home is a form of savings because an individual’s wealth merely changes form. More importantly, it is a form of saving that occurs while spending. Building a home requires paying for materials and labor that results in an asset under the control of the saver as well as income to providers of those inputs. Withholding meanwhile is saving without spending. It simply involves setting aside some portion of funds. Ultimately the difference between the two is that saving can be positive-sum whereas withholding is zero-sum by definition. Thus,
Saving = Investment + Withholding
But since withholding is zero-sum, then across the entire economy:
Saving = Investment
This can easily be rewritten to look at individual sectors of the economy so that the above turns into:
Household Saving + Government Saving + Corporate Saving + Rest of the World Saving = Investment
Since Corporate Saving represents earnings that are not paid out as dividends,
Corporate Saving = Corporate Profits – Dividends
Through some substitution and basic algebra, we’re left with what’s called the Kalecki – Levy Corporate Profit equation. It’s an accounting identity (much like the well-known GDP = C + I +G + Exports – Imports) and thus is definitional in nature; it is a required result, but not necessarily causal. Importantly, it applies to the economy as a whole and not an individual sector or household.
The Kalecki-Levy Equation
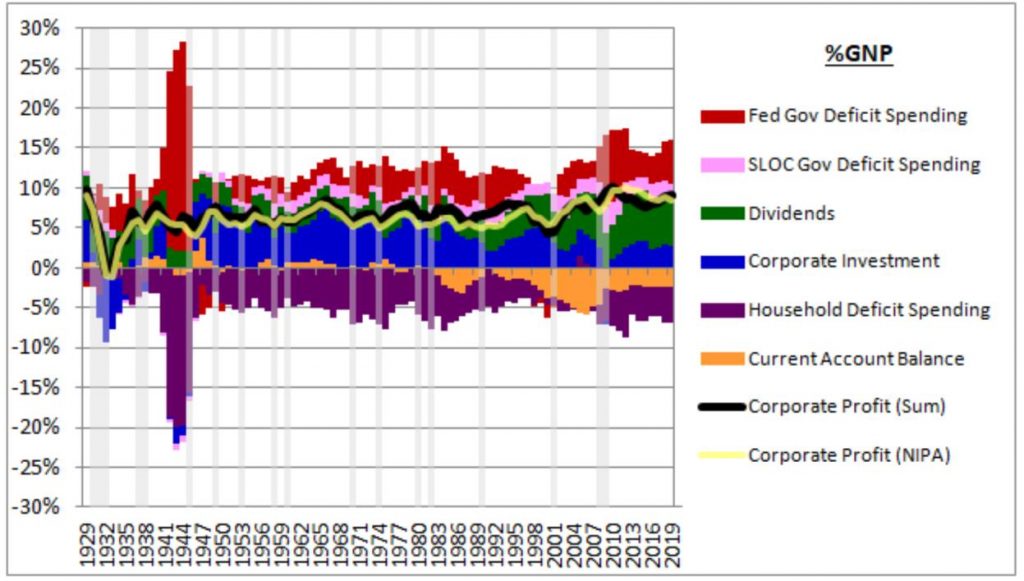
Corporate Profits = Investment + Dividends + Current Account Balance + Government Deficit Spending + Household Deficit Spending
As background, Michal Kalecki was a Polish economist who actually wrote many of the same ideas Keynes put down in his General Theory of Employment, Interest, and Money but Kalecki published his work a full three years before Keynes. Among his many contributions are some of the principles that we now come to understand as the multiplier effect, namely that one person’s spending was another’s income. This realization is apparent in the above equation. Financial wealth that is born out of deficit spending ends up landing somewhere else via income or eventually, after circulating throughout the economy, on a balance sheet.
Data from the Bureau of Economic Analysis’ National Income Product Accounts validates the identity.
Figure 1: Corporate Profits Reported vs Implied via Kalecki-Levy (Source: Jesse Livermore)

With the Kalecki-Levy framework we can have a better understanding and fuller appreciation of the impact that fiscal stimulus in the US can have. For some perspective consider the following. In the midst of the Financial Crisis the US instituted between $1.5 and $2 trillion in fiscal stimulus over the course of roughly 4 years and two different administrations. To combat the impact of COVID-19, the federal government has authorized $3.6T in stimulus, amounting to between 80% and 140% of the stimulus during the GFC but in a fraction of the time. Further, in 2019 every term in the Kalecki-Levy other than government spending (investment, dividends, ROW saving and Household saving) amounted to $4.7T but the measures deployed just by the federal government will be over 75% of that in a far shorter amount of time and before any consideration of saving or investment by any other party.
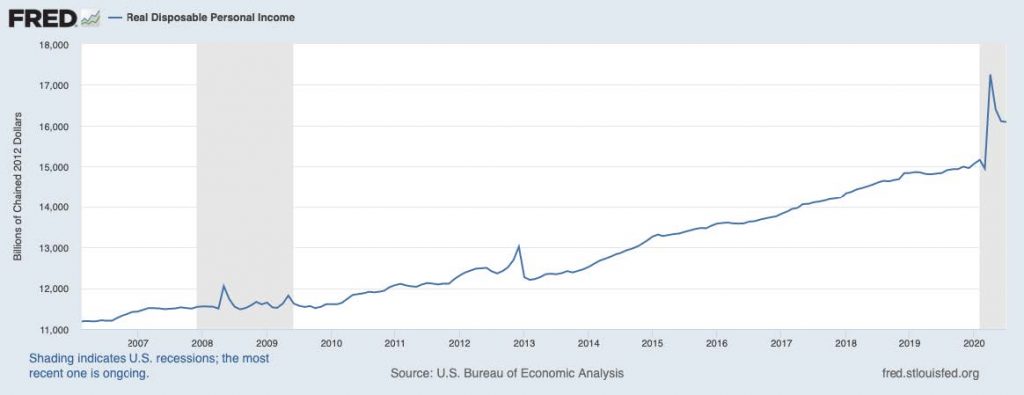
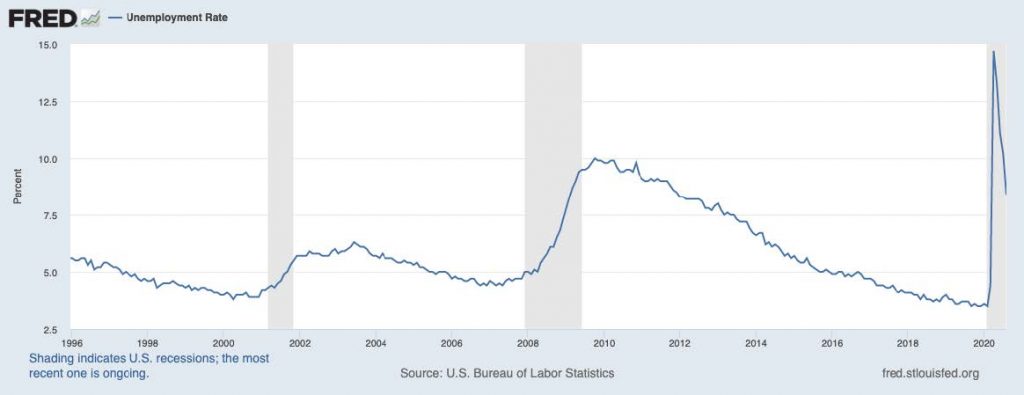
Put simply, the fiscal stimulus measures deployed this past spring are enormous. They are without historical precedent during a time of peace. It’s why we saw the net effect result in huge increases in Personal Disposable Income despite the fact we had the highest levels of unemployment in history.
Figure 2: Real Disposable Income and Unemployment (Federal Reserve)
The inspiration for explaining Kalecki-Levy and its implications for me is two-fold: first, I wrote back in April of my skepticism for any sort of V-shaped recovery. Whether looking at the rate of recovery in the general economy, earnings, or the capital markets the case for a rapid bounce back didn’t make sense to me. Regardless of how tenuous one may find the current recovery (myself included) the fact of the matter is that the analysis from this Spring while sound in theory still proved to be inaccurate, and so I searched for credible reasons why. The first possible explanation was that the market was pricing in new efficiencies being brought to the present faster thanks to behavior changes inspired by COVID-19. Things like digitization, cloud services, digital payments, telemedicine, etc. were being priced in at a faster rate. Further, for many beneficiaries of these trends they saw new business and faster growth without having to do any marketing, deploying a sales force, advertising and other means of acquiring customers because demand was brought to them rather than having to go find it. As a result, the marginal business one occurs at a more profitable rate. While intriguing as a theory it’s difficult to prove.
The second catalyst was the recent publication of Upside-Down Markets: Profits, Inflation and Equity Valuation in Fiscal Policy Regimes by Jesse Livermore (pseudonym), one of the best market thinkers I know of and who deserves full credit for the explanation and framing of Kalecki-Levy above. While lengthy, it’s a critical read to understanding the current economic and market environment, as well as where we may be headed given the tools deployed to fight the economic impact of COVID-19. In the piece, one plausible scenario offered sees Corporate Profits down just 5.5% this year thanks in large measure to the fiscal spending.
There are certainly other explanations that have been offered but they have not struck me as having the same degree of potency and relevancy as offered by the fiscal stimulus of this spring, with more potentially to come.
Take the role of the Fed for instance. Cutting rates on March 3rd did nothing to stem the selling in the markets. Nor did another rate cut a couple of weeks later. Another bond buying program announced on March 23rd did nothing. The very next day however we got word of breakthroughs in a fiscal package leading to headlines like this in the New York Times:

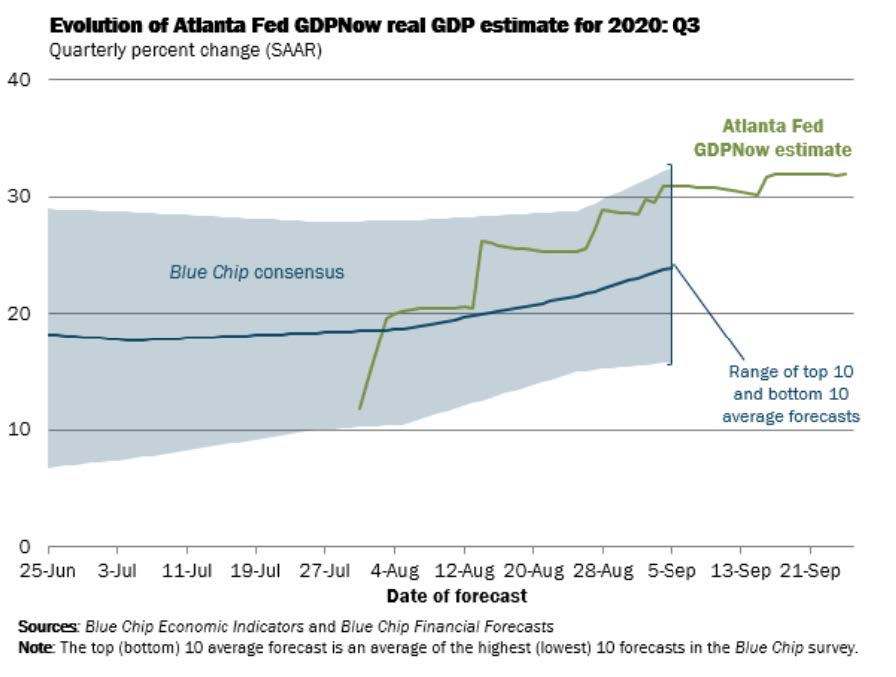
Further, the entire increase in the money supply we’ve seen this year hasn’t led to any increase in lending or credit growth. Reserves have grown but base money has no impact on the economy without credit demand; even the Fed has told us this. As such, there’s no way to connect the activity of the Fed to the fact that the economy is on pact to grow at an annualized rate north of 30% in the third quarter.
Figure 3: Q3 GDP Estimate (Federal Reserve Bank of Atlanta)
As far as the markets, other explanations such as excessive speculative activity just doesn’t hold water. While some individual names may see some speculation when looked at the market as a whole that trend isn’t apparent. Year to date, investors have been net sellers not buyers and sentiment remains quite bearish.
Figure 4: Year-To-Date Flows Have Been Negative for Stocks (Ned Davis)

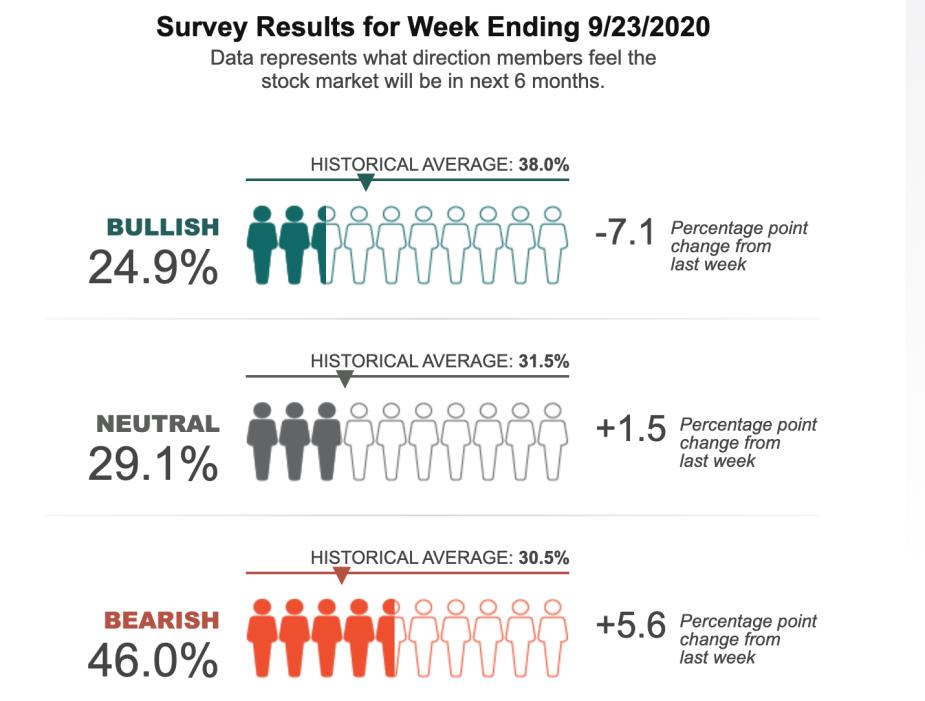
Figure 5: Investors Are Still Not Bullish (American Association of Individual Investors)
The simple conclusion from all this would be that the economy remains fragile, held up by a historic fiscal response that if taken away once and for all threatens to push the economy back into recession.
That is one possible scenario but it’s far from the only one and is a frequent mistake people have made in the past. Many investment experts around 2012 warned of a “double-dip” recession because deficits were being curtailed. What they failed to take into consideration was that the private sector was healing and increasing demand, leading to a rise in investment that took the baton from fiscal deficits. As a result, Corporate Profits continued growing by about 5% per year despite a 30% decline in the deficit.
As a result, we should strongly consider that the fundamentals of the economy may have bottomed earlier this year. Whether that means that risk assets at their current price level offer attractive risk-reward opportunities is another question entirely.