
The Wooden Nickel is a collection of roughly a handful of recent topics that have caught our attention. Here you’ll find current, open-ended thoughts. We wish to use this piece as a way to think out loud in public rather than make formal proclamations or projections.
1. When Breadth is Bad…What if It’s Not Iran?
“There’s only two prices for private credit – 100 or zero.” – Jeff Gundlach
It’s been a source of (unnecessary) anxiety for some these last few years, bemoaning the outsized gains a handful of large, enormously profitable technology firms have had. We’ve dubbed them the Mag 7 and created this (false) narrative that they are the only ones bearing fruit. Take this headline from Business Insider this past December:
It’s a bit ironic given that the Mag 7, as a group, peaked on October 29th last year and has steadily declined since. The tech-heavy Nasdaq ETF (QQQ) peaked the day before. Since that time, we’ve gotten the elusive desire for breadth that people have been clamoring for. In fact, up until about a week ago, this was the broadest period of strength to start a calendar year in quite some time. From Bloomberg:
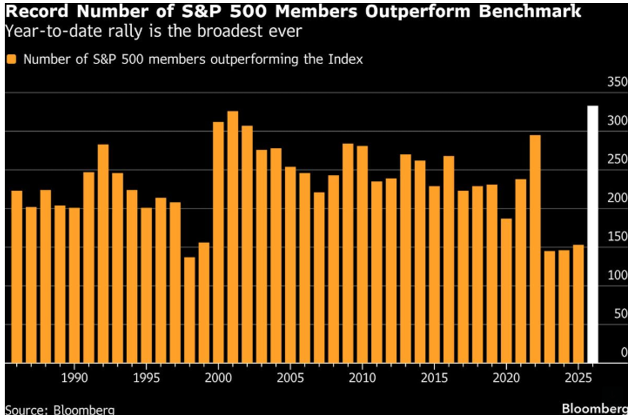
Just over 60% of the S&P 500’s constituents were outperforming the broader market. At the time the above chart was produced, the large-cap index was up a measly 0.39% calendar YTD. Mid-cap stocks, meanwhile, were up over 8.5% and small-cap stocks were up over 9%. Not to mention the 11% rise in Emerging Markets, 12% rise in Japan, and 6% rise in the Eurozone.
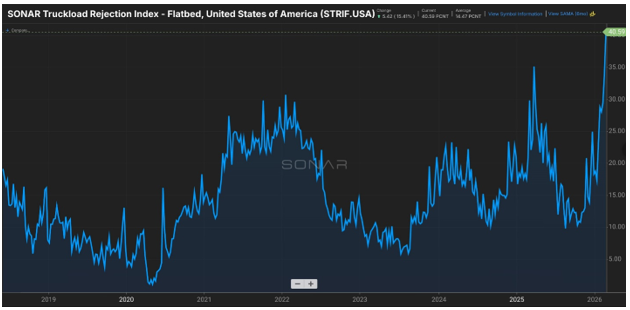
You can see the breadth in some of the macroeconomic data. The industrial economy, outside of building data centers, has been stuck in the Covid slump since 2022. Yet the ISM manufacturing index has had its best two-month stretch since 2022. Similarly, trucking demand, measured by the number of truckloads rejected by suppliers (due to insufficient capacity), is higher than even the Covid-era peaks. Industrial loads served by railroads are at the strongest level in 3 years, per UBS.
Figure 1: Freight Wave’s Truckload Rejection Index Highest Levels Ever
But notice when other moments of significant breadth performance occur in the Bloomberg chart above. Rarely do more than half of the large-cap index outperform. Those scenarios are outliers. Notice when they occur. 1999-2000. 2007-2009. 2014-2015. 2022. Each one of those times saw earnings contract following enormous breadth expansion (emphasis on the degree of breadth is necessary here). 1999 was the peak of the dot-com bubble. 2007-2009 was the onset of the GFC, in which a similarly imbalanced market (led by banks and energy) contracted severely at the index level, allowing for the “median” stock to outperform. 2014-2015 saw an earnings recession led by the industrial economy. 2022 saw us looking down at the Covid cliff and the 40% fall from the top.
Which brings me to the market of this past fall. As tech stumbled, the baton got passed. And what led? It was Financials, the second-largest sector in the 500. While materials and energy have gotten the bulk of attention the last few months, you could combine their weighting, double it, and it would still be smaller than the Financials sector. Credit is the lifeblood of the economy after all, and Financials were kings of the lauded rotation in financial markets.
Until February. Coinciding with fears of the death of software and geopolitics has been the shadowy drama in the private credit world. And the contrarian conjecture I would offer is that it is this pain point that matters more for the future direction of the market in the near term than what transpires in the Middle East.
Just consider that in the first trading day after the U.S. launched strikes on Tehran, futures pointed to a heavy red open. The market finished green. Just two nights ago, once again, futures pointed to a heavily red open after the “demand” of complete surrender (whatever that means). Down 3% overnight on all major indices. The Nikkei was down over 5%. Yet all day on Monday, the S&P 500 moved up and to the right. By the time we got our latest TACO from the administration, the S&P 500 was down a mere 30bps. From -3% to -30bps in a handful of hours. No news.
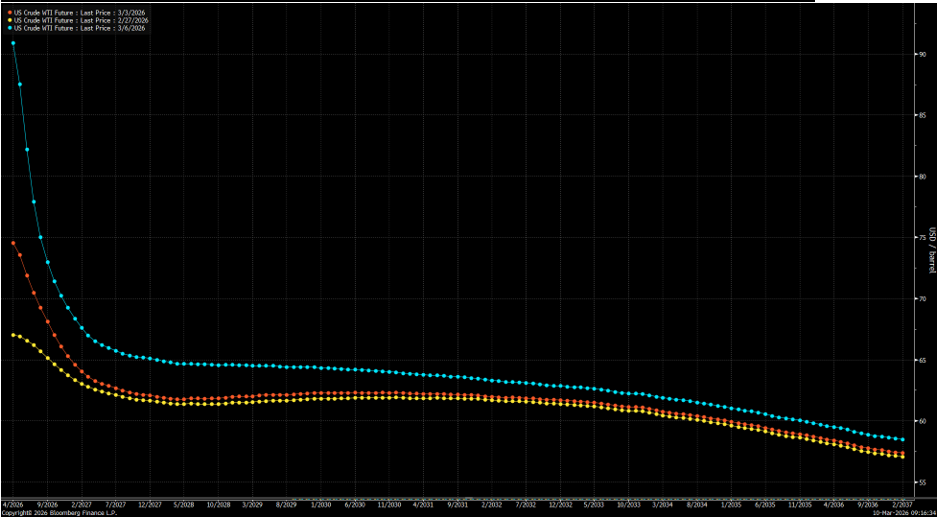
Let’s even look at oil. I would strongly argue that even the crude market wasn’t overly concerned with the war in the Middle East. While everyone was staring at spot prices, did anyone bother to look at the futures curve and compare it to before the strikes? Backwardated and sitting at the high-60s/low-70s just a few months out. Elevated? Sure. Crippling and a danger to the global economy? Hardly.
Figure 2: Oil Futures March 6th (Blue), March 3 (Orange), and February 27 (Yellow)
If you want to argue that markets are being complacent about what’s going on in Iran, that’s fine. But I don’t think you can simultaneously argue that the headline volatility in the major indices flows from Tehran.
Now, notice the headlines in between and throughout last week when the market was down.
- Blackstone stated that redemption requests totaled nearly 8% from its premier credit fund and that, unlike other private credit funds, it wasn’t gating the redemption requests. The stock was down 8%, and markets fell alongside it.
- Blackrock marked a loan to an e-commerce company down to zero. 3 months ago, that loan was marked at 100. (Perhaps Mr. Gundlach is correct in his jest).
- Later in the week, Blackrock took the opposite tactic of peer Blackstone, and limited requests for private credit redemptions. The stock fell 7%, dragging much of the sector with it.
- A private credit fund run by KKR fell by 15% in one session after admitting an increase in troubled loans. At the heart of the issues were loans to a recent software buyout deal from 2022; loans were marked down to 80c on the dollar.
And that doesn’t even include the shenanigans at Blue Owl, where retail redemptions have been canceled indefinitely.
As a final aside, let’s remember a few things:
- The AI trade is now a capital markets-dependent trade. Meta, Oracle, Google, and Microsoft will combined hardly have any free cash flow this year. Even with margin improvement, revenue growth, cost cuts, and the like, the second derivative of capital expenditures growth has peaked. The only way around it is to issue debt, sell shares, or engage in off-balance sheet financing like Meta did last year. Its partner? Private Credit. Is there appetite or capacity for that to continue?
- Roughly 20% of private credit assets are directed to the software sector. The very same sector being pummeled by advancements in A.I. And these are not the crème de la crème of software assets. There’s a reason that distributions from private equity remain at their second-lowest level since 2008; they spent too much on inferior companies. And where did they borrow from?
- There is always contagion, not containment, in credit cycles. It may be a small asset class in the grand scheme of things, but a) its connection to the banking system is undeniable, b) it has been the dominant source of credit growth in the last few years, and c) lacks true transparency.
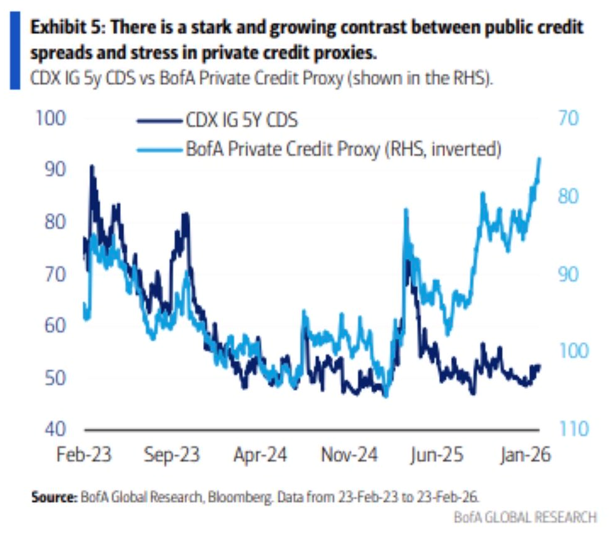
- Will this be a full-blown credit crisis? Probably not. There’s a reason those types of events are once in a century. But is it priced correctly? And if not, can a more true repricing bring down the market with it? Now that is a more interesting and relevant question (Figure 4).
Figure 3: Loans and Leases to Nondepository Financials (aka Private Credit) Have Exploded, Source: Federal Reserve
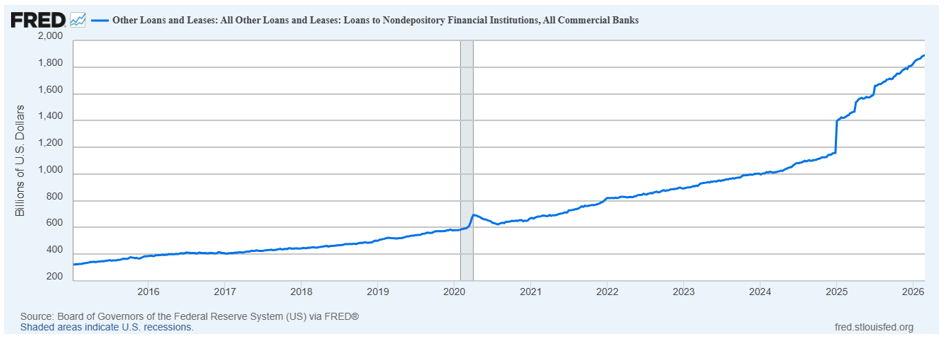
Figure 4: Something Isn’t Right in Credit Markets, Source: Bank of America
By the way, the market lost Financials before Iran was ever struck. The sector lost its 200-day moving average in the days before missiles flew, and even in yesterday’s green tape, the sector still finished in the red. It is firmly at the eye of the storm.
2. A Contrarian Take on Big Tech Earnings
“If you owe the bank $100, that’s your problem. If you owe the bank $100 million, that’s the bank’s problem.”
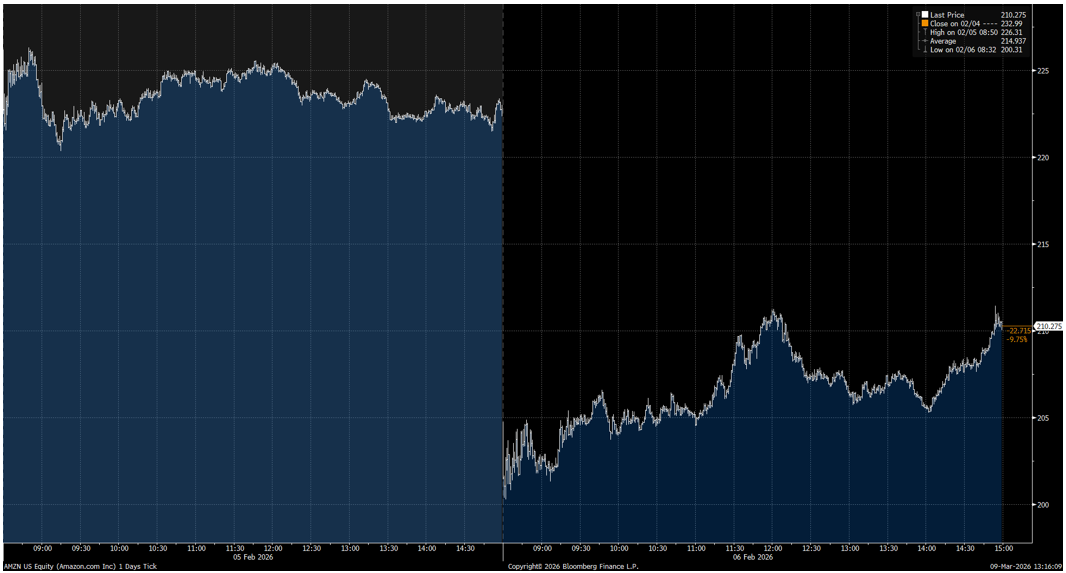
Amazon, the last of the major hyperscalers to report earnings, echoed much of what we heard from peers Microsoft, Meta, and Google. Consumption of AI services was constrained by the inability to supply enough capacity to meet demand. As a result, spending would increase. Amazon projected capex to rise to $200B in 2026 (inclusive of their retail business). It represented a 50% increase to 2025 figures and came a day after Google announced a doubling of its own capex, which followed a 75% rise from Meta. Amazon’s stock, like Google’s, fell the next day despite the optimistic commentary.
The immediate rationalization has been that investors dissaprove of the rising investment levels and are back to the 2022 playbook of reprimanding management teams for a lack of free cash flow. Maybe, but I think there is an alternative explanation that may not be appreciated.
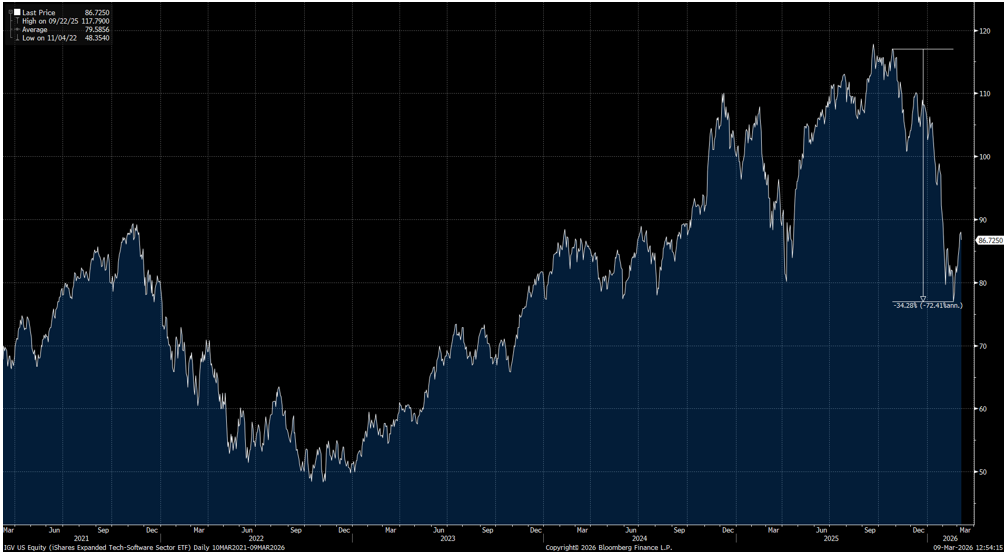
Given the investment and attention devoted to the buildout of A.I. infrastructure and applications, it could be useful to remember that the largest customers at the hyperscalers are the most public SaaS vendors (Adobe, Salesforce, Intuit, etc.). The very same customers who’ve seen a rapid and violent repricing in their shares. Here’s the IGV Software ETF, down 35% in the manner of two months:
Figure 5: IGV Software ETF
The catalyst, allegedly, was the launch of Anthropic’s Claude Code under a new model. It wouldn’t be difficult to find A.I. experts and tech specialists proclaiming it the biggest moment since ChatGPT launched in November 2022. I’ll spare the intricacies for now (though I’d agree with the early assessment, having played and built tools directly with it).
The ability to marry natural language processing with digital tasks has people reimagining what software can be and who can provide it. It has rocked horizontal applications (such as sales management) to specialized services like financial services and the legal profession. In short, Claude and ChatGPT would eat everything.
All of this makes me ask: Is the market extrapolating capex from the hyperscalers as being a direct assault on cloud SaaS? Are they cutting off their nose to spite their face? At some point, it’s not just the ROIC of the hyperscalers that matters but also the ROIC of the hyperscalers’ customers. Now, a reasonable retort would be that the capex is not cannibalistic. That it is simply one customer replacing another.
That is true to a degree, but if the logic is that the frontier AI labs will eat SaaS on their own, they will be of such enormous size that it would benefit them to look into building out their own infrastructure. It’s not a new story. Google built its own chips for YouTube so it could save the cost of building an entire data center. They also trained and run Gemini on their own accelerator chips. Apple insourced chip design to improve performance. The hyperscalers run their own infrastructure in addition to relying upon external capacity from providers like Equinix. Tesla insourced production of battery cells.
Could it be that the market sees the AI labs as customers to the hyperscalers only for the short term? Probabilistically, it’s not likely, but if there was a slight chance of it, how would that probability be priced in the market?
3. The Best Short
It’s long been a point of contention in this publication that investors do not get paid for the consensus viewpoint. So imagine someone bold enough to put forth the following declarations in the public purview:
February 22, 2020: The coming bull run for the big 5 tech firms
- The Result: a 40% decline in weeks. Good luck holding on through that.
November 19, 2022: The Downfall of Crypto
- The Result: A tripling in bitcoin’s price, even with the 30%+ decline in the last few months.
January 18, 2023: Goldman Sags: a bearish take on Goldman Sachs
- The Result: A 185% return through 2025 in the investment bank, more than double the S&P 500.
March 18, 2023: Forecasting Trouble With US Banks
- The Result: A 130% return through 2025 for the KBW Bank Index to the S&P 500’s 83%.
February 10, 2024: Xi’s Chokehold on China’s Equities
- The Result: A 64% return in broad market Chinese stocks and a greater than 50% in the internet-heavy KWEB ETF. Both outpacing U.S. markets.
October 19, 2024: America’s Economic Exceptionalism
- Since then, U.S. markets have lagged the Nikkei, Emerging Markets, and even Europe.
December 7th 2024: A Gambling “Frenzy” in America
- A 46% decline in shares of Draftkings and a 60% decline in Flutter, the two leaders in America’s digital gambling markets.
August 2, 2025: Greenlash. The demise of wind and solar energy
- A 25% rise in FAN, a wind energy ETF, and a 45% rise in TAN, a solar energy ETF.
Yes, the above track is very real and very public. And it illustrates that there are various points in which views become the consensus. It’s why we have the phrase that news is “priced in.”
And what’s the latest prediction?
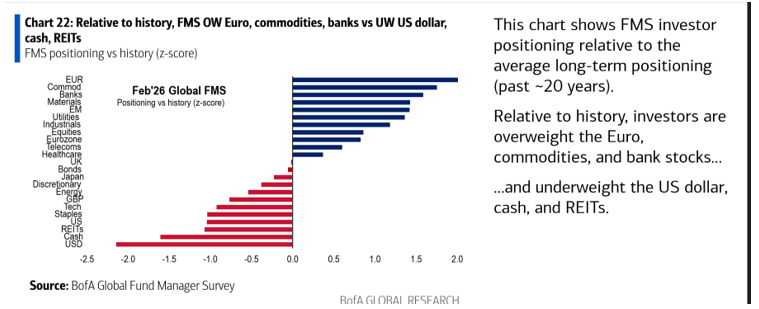
Markets love to punish the consensus and tip over boats when everyone is on the same side. And if there is ever a proxy for when one view becomes consensus in the public consciousness, it is the magazine cover. And as of February, the trade EVERYONE hated was the dollar. Per Bank of America:
Figure 6: Bank of America Fund Manager Survey
If I had to make a contrarian bet for 2026, it would be that the dollar makes a mockery of this bearishness. It could happen for a myriad reasons (postponement of rate cuts on US economic health, inflation rekindling, geopolitics, money flows, or market bearishness pushing people to cash). And that’s what should concern people. It pairs with a wrecking of many narratives present in the market now.
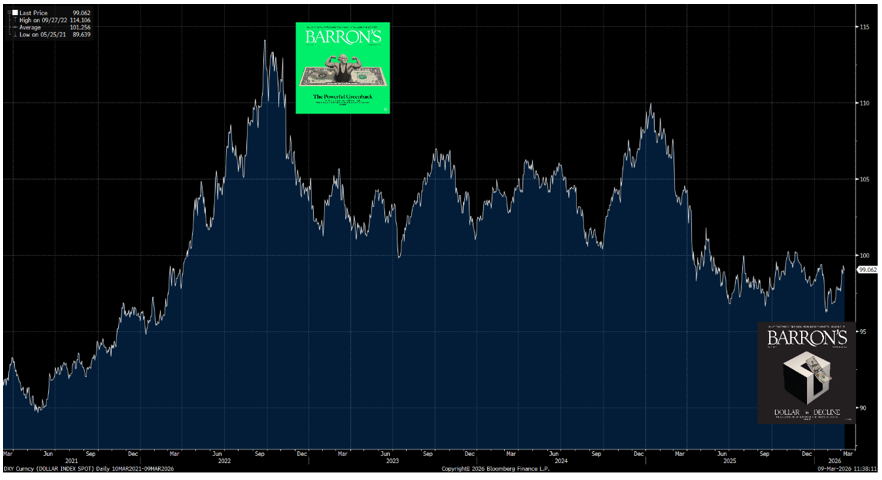
And if you’re wondering, no Barron’s is no better, touting the dollar’s strength in October of 2022, exactly when the market bottomed. And they joined the party just two weeks ago. The last dollar prediction they made didn’t go so well (Figure 2).
Figure 7: The Dollar Index and Consensus Bets
4. Recommended Reads and Listens