
The Wooden Nickel is a collection of roughly a handful of recent topics that have caught our attention. Here you’ll find current, open-ended thoughts. We wish to use this piece as a way to think out loud in public rather than formal proclamations or projections.
1. Forecasts are Hard
In going through some old research these last few weeks we stumbled upon an initiation report of Nvidia, 2023’s darling stock. The report had some foundational facts that were refreshing to go through again, but in reading the report, it reminded us of a distinction made on this page before regarding the difference between value creation and value capture. We alluded to airlines as an industry that exemplifies the distinction. Something can have a massive secular tailwind, like travel does, and be sought after and enjoyed and grow and still be a lousy investment.
Computing capacity in data center servers has grown at a 50% CAGR for decades (the report is dated and thus the data is somewhat stale but the trend has largely held). The exact figure may be surprising but to see that computing power has grown rapidly for a persistent period of time makes intuitive sense. Technology and computing have become ever more ubiquitous and present for everyone.
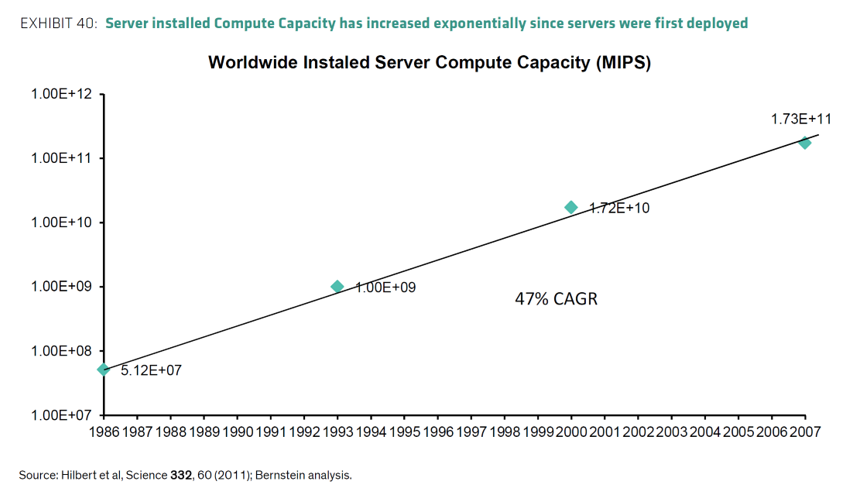
But if an investor took the trend as a rising tide to lift an entire space or ecosystem, they would have been sorely mistaken. Figure 2 shows that server spending (measured in dollars) hasn’t grown one bit, topping out at $60B.
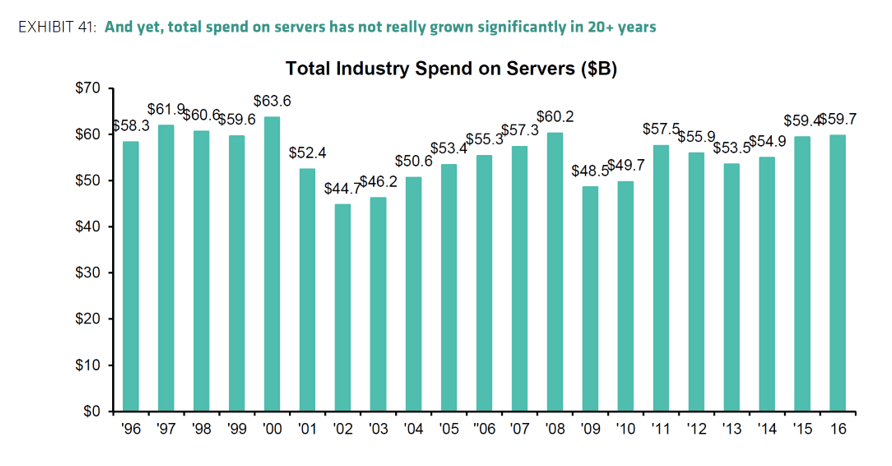
While an enormous amount of value was created, giving us things like the cloud, mobile computing and more much of that value was passed on to end users and not captured within financial statements.
So when you start to hear about a new paradigm or model, remember that it tends to reorganize assets and resources and the way an industry operates, and that it is not simply a linear tide that elevates all participants.
2. The Great Term Out
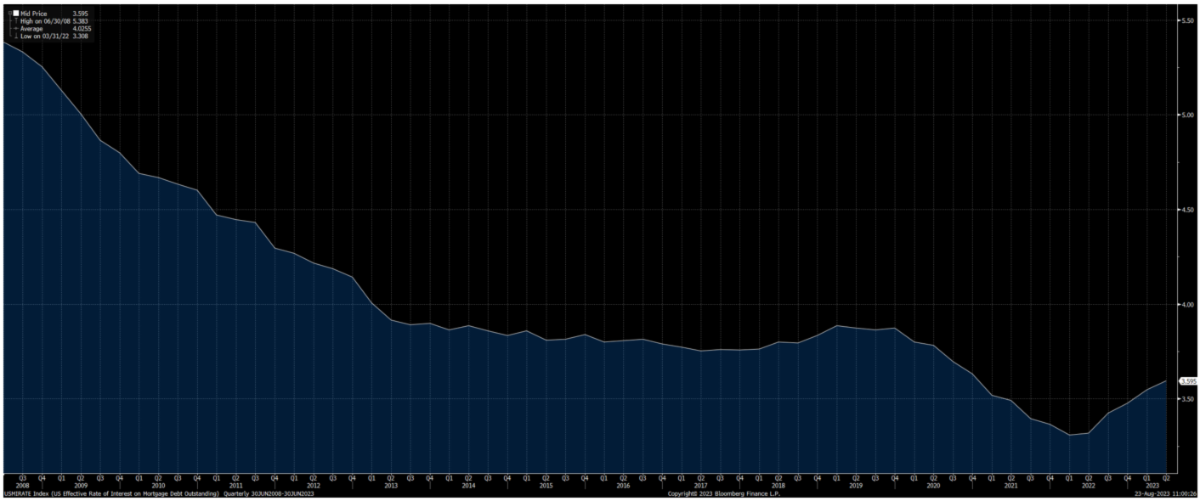
We mentioned in the prior edition of the Wooden Nickel that fears over household balance sheets were grossly misstated for several reasons. One was that debt capacity had been freed up tremendously as households took advantage of record-low rates. In fact, mortgage rates have now been above 6% for a full year and stand at 7.5% currently. Yet the average interest rate on the outstanding stock of mortgage debt is just 3.6%, demonstrating the volume of debt that was refinanced at record low levels.
The release of the Bank of International Settlements’ Quarterly publication this week put some context around the same phenomenon in the corporate world.
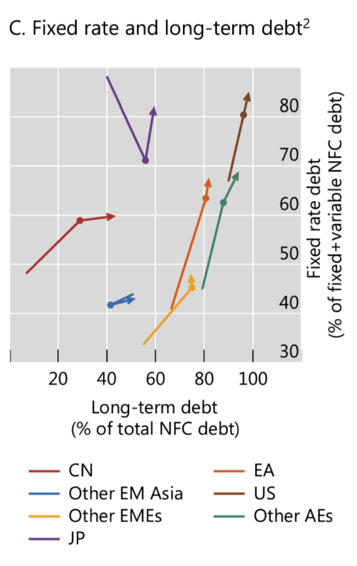
Figure 4 shows a similar trend for just about every economic area in the world from the beginning of 2022 through Q2 2023. Short-term debt was swapped out for long-term debt (the bottom axis) as rates collapsed around the world. If you were happy to take out a loan at a given interest rate for 1 year, why not extend it out to 5 years if the rate is no higher? That’s one effect seen here.
The second is on the vertical axis. A greater proportion of debt was tied to a fixed rate, as opposed to a market-based floating rate like LIBOR/SOFR. The US has always had a greater proportion of debt in fixed terms, at nearly 70% pre-COVID, and longer term, at over 80%. Both of those figures moved up substantially considering rates collapsed with the former moving to ~80% and the latter close to 100%.
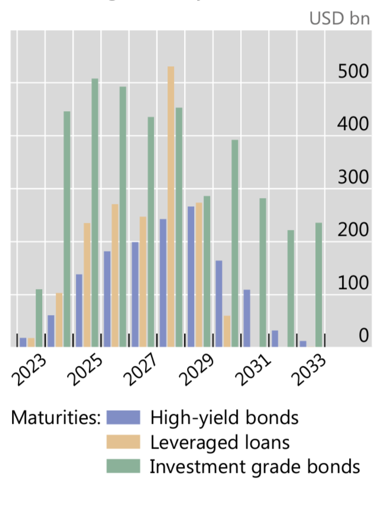
Along with substantial fiscal support, the term out of rates has helped keep the economy afloat for much of 2023. Of course, it’s not a permanent solution as maturities will need to be refinanced at new, higher levels of interest. Based on current estimates from the BIS, that seems to be a 2024-2028 story.
3. Fear and Greed
CNN’s Fear and Greed Index is a popular indicator that investors and market watchers like to use as a contrarian indicator. The crux of the index is based on mean reversion and goes against the extremes of emotional investing. When digging under the hood though, it’s quickly apparent that the Fear and Greed index is trying to measure multiple things and bundle it up into one neat little package.
The underlying components are:
- Market price momentum
- Price Strength as measured by 52 Week Highs and Lows
- Stock Price Breadth
- Put Call Ratio
- The VIX
- Safe Haven Demand as measured by the difference in 20-day stock and bond returns
- High Yield Spreads over Investment Grade Bonds
Of the seven indicators that go into the composite index, maybe two (the VIX and Put Call Ratio) could be argued as actually attempting to measure current sentiment. The rest don’t really belong in a sentiment measure. For one, things like momentum, price strength, and breadth are correlated and indicative of future gains in the market, not a reversion. If anything, they confirm the persistence of past gains, not their imminent decline. Second, I’m not sure why a single month’s worth of returns between stocks and bonds offers any substantial value. The metric on a wider scale holds some value as an intermarket relationship but by no means must mean revert. The same goes for High-Yield spreads. Some intermarket value? Sure, but by no means is it required to mean revert.
It’s nice to use sentiment as a contra indicator to make sure you’re not a sheep among the herd. Just don’t count on this index as a useful guide.
4. What a Bottom Looks Like
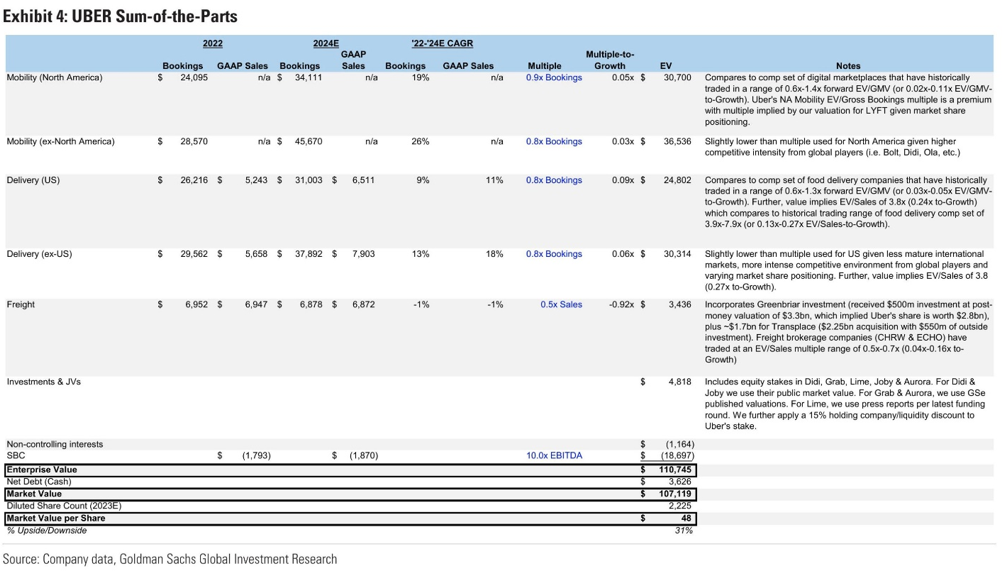
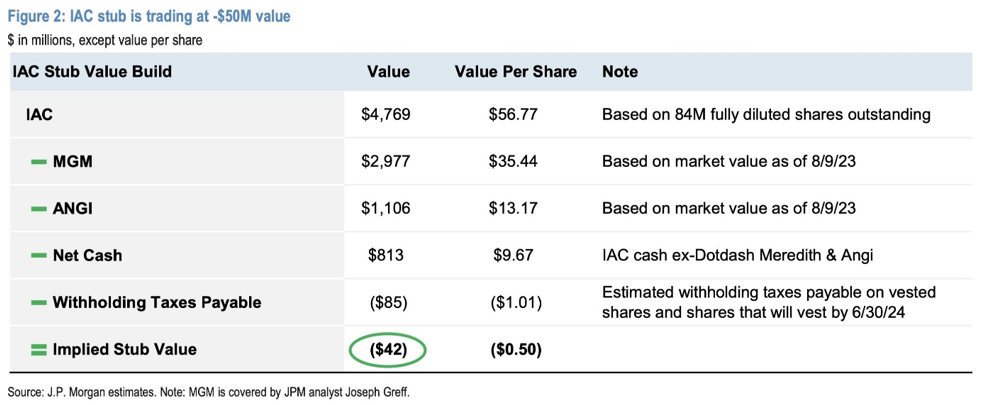
A colleague and I were discussing some of our favorite set ups historically in the market – situations that serve as a template for future use. One we both mentioned was what we called the “Sum of the Parts Double Speak.” For those unfamiliar, Sum of the Parts analysis is a framework often used to analyze companies with disparate businesses under one roof. Analysts will isolate certain parts of the overall conglomerate and see if the remaining value makes sense. If not, there could be a valuable opportunity at hand. Figure 6 shows examples of these analyses with UBER and IAC, respectively, whereby the analyst argues the former has nearly 50% upside and the latter is trading at negative equity value.
But in the context my colleague and I were referring to, it’s usually in the case when opinions are overly bearish. To give a current example (and this certainly does not constitute investment advice), take the case of Disney.
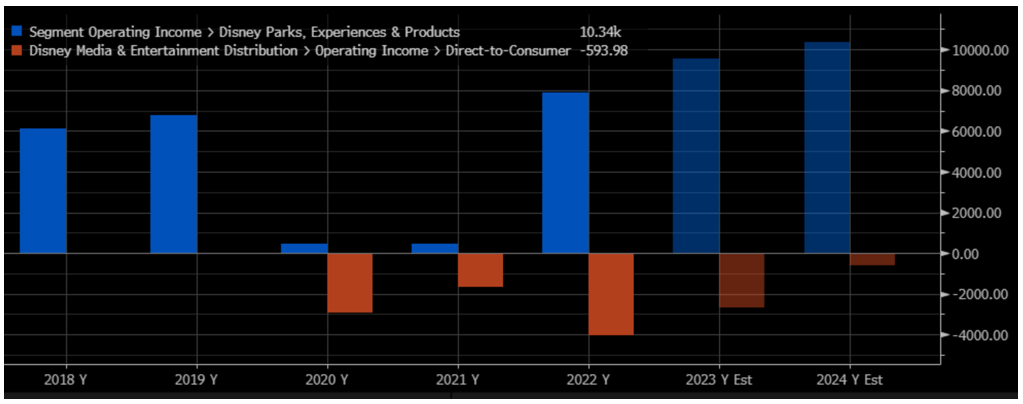
Disney’s parks business, after essentially becoming a zero during the worst of Covid, has come roaring back and is set to post over $9B in Operating Income at the close of the current fiscal year next month. That figure is over 40% higher than their 2019 levels. Meanwhile, the famed subscription service continues to see losses pile up, reaching over $4B in 2022, a 140% increase in losses from the prior year.
Here’s where the double speak comes in. A skeptic looks at the parks business posting record results and says, “Uh oh, it’s a top. It can’t get better than this.” Simultaneously, they’ll look at the subscription business and say “Look how awful performance is and it’s gotten worse in the past year. How can anyone buy into that? It’s fundamentally broken.”
On the former, they’ll be seemingly proactive to anticipate a turn downward in the business. On the latter, they’ll look at current trends and think reversion is out of the question. Hence the double speak. If one side of the coin can’t get better, why isn’t that the other side can’t get worse? Of course, that assumes the starting premise of the parks business not even getting strong is true, which may not be true. Regardless, when you hear critics talking out of both sides of their mouths, it’s usually a good sign that sentiment is nearing a bottoming point.
5. Recommended Reads and Listens