
The Wooden Nickel is a collection of roughly a handful of recent topics that have caught our attention. Here you’ll find current, open-ended thoughts. We wish to use this piece as a way to think out loud in public rather than make formal proclamations or projections.
1. Dr. Copper vs the 2-Year
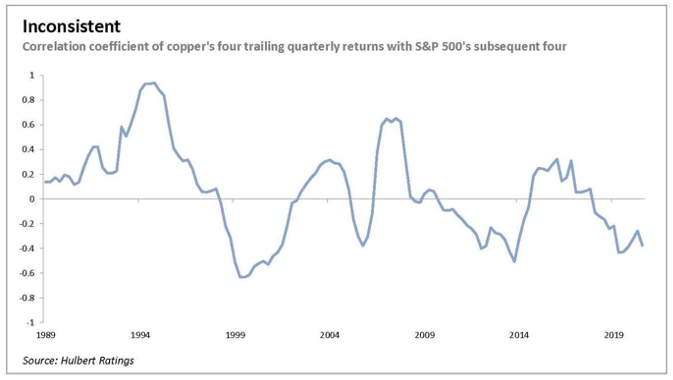
There’s a common quip among market professionals that copper holds a Ph.D. in economics. It’s pervasive uses and sensitivity to economic growth make it a proxy for the state of the global economy and thus future profits. Coppers demand cycles move in lock step with broader economic cycles. At least in theory.
In practice, the story is quite mixed. Sometimes the relationship is very strong. Other times the correlations get extremely negative. And other times there’s no material relationship at all.
Figure 1: Dr. Copper’s Poor Forecasting Ability, Mark Hulbert
No single indicator should be utilized as a proxy for something as complex as the global economy or profit pool of global corporations. But when it comes to noting tipping points around contractions and expansions one indicator that is notably better in my view than copper’s mixed resume is the 2-year treasury yield.
Long-term rates are, in some schools of thought, future expectations of short-term rates with added premiums for risk and time. Thus, short-term rates are more prone to move in lock step with the economy at hand but more importantly are a good window into future policy shifts.
Figure 2: The 2-Year Yield As an Economist
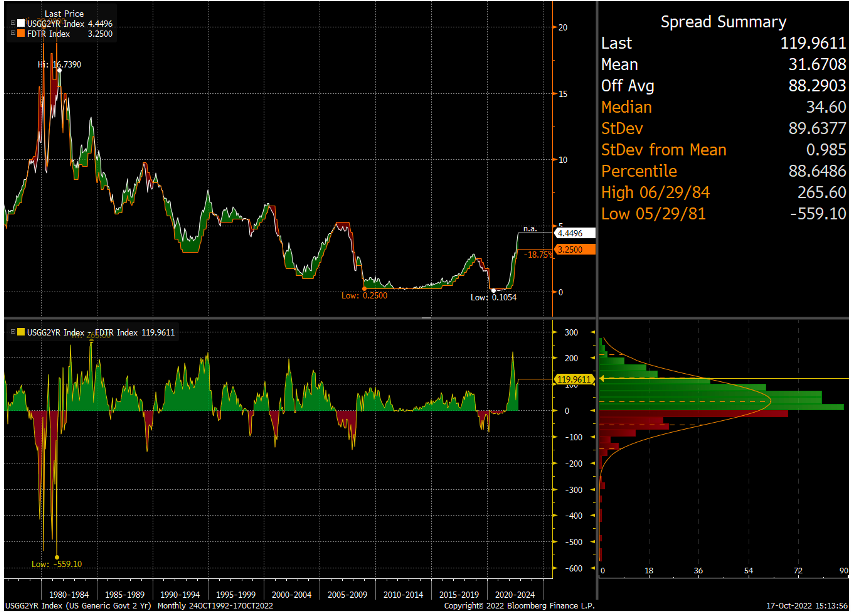
The top half of Figure 2 shows 2-year yields along with Fed Funds but the bottom panel is more instructive, showing the spread between the two. In red, Fed Funds exceed the 2-year, inverting the curve. Inversion tends to happen because of a deviation between the policy rate and the 2-year. The latter, looks out further than policymakers are able to and is able to smell trouble in the economy and the eventual rate cuts that ensue. When it rolls over while Fed Funds stay steady or rise, then it’s time to be concerned.
Figure 3: The 2-Year Hasn’t Rolled Over Yet
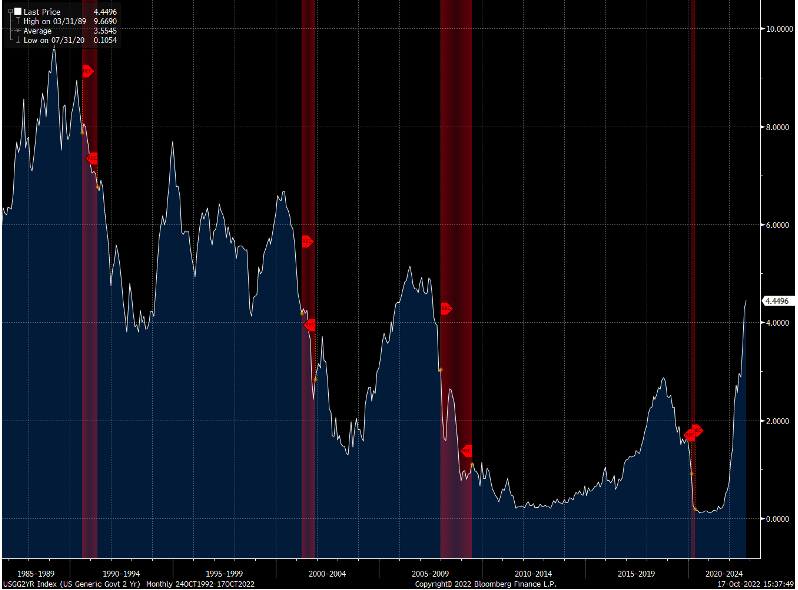
Maybe the present inflation dynamics have thrown a wrench into the forecasting ability but this will be an indicator to monitor going forward.
2. Voting With Their Wallets
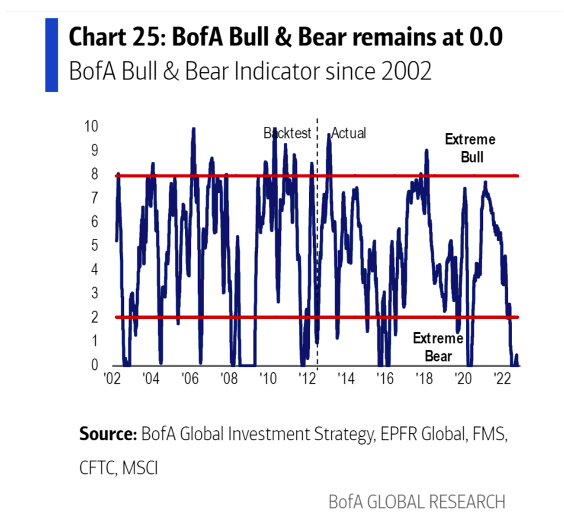
It’s not hard to find indicators that suggest investor sentiment towards risk assets is poor, setting up some ammunition for a reversal or at the very least another bear market rally. The AAII Investor Sentiment Survey recently showed one of the most pessimistic levels of sentiment toward stocks in recent times and the 4-month moving average of the indicator is approaching Financial Crisis levels (Figure 4). Bank of America’s Bull & Bear Indicator is at exactly zero according to the latest publication. And according to the latest data from the CFTC speculative positioning has turned negative, and near recent periodic lows, a frequent data point cited by bulls.
Figure 4: By Multiple Measures Sentiment Is Pessimistic
A) AAII Bearish Sentiment Levels (White) and 4 Month Average (Pink)

B) Bank of America Bull & Bear Levels Don’t Get Any Lower
C) CFTC Data Shows Traders Net Short
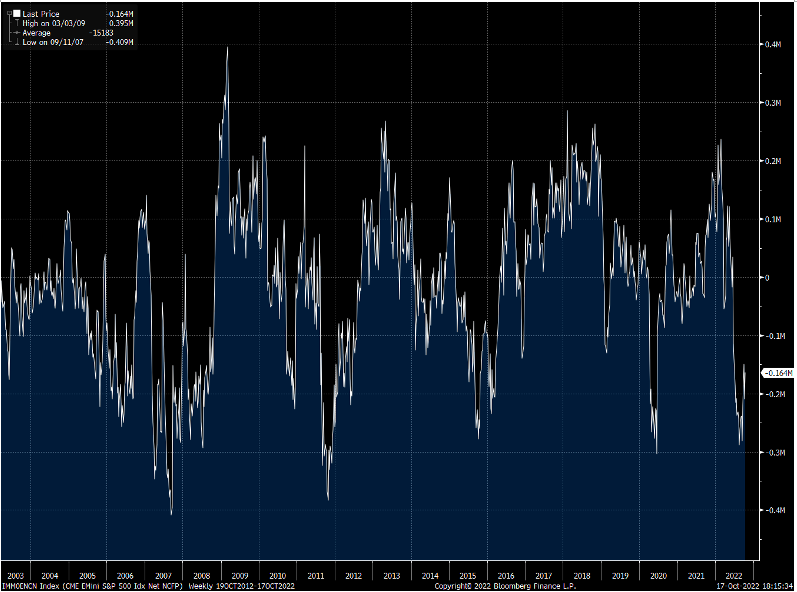
But as they say, talk is cheap. Responding to a survey is one thing but it doesn’t represent skin in the game. Sentiment is far more volatile than both fundamentals and portfolio positioning. If you want to rely upon past investor behavior to look for signs of capitulation look to see what they do with their wallets.
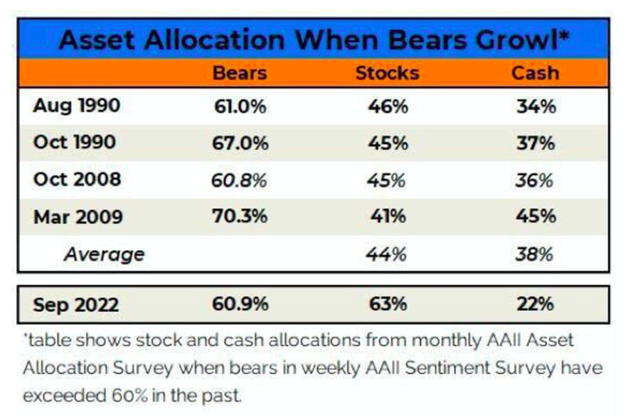
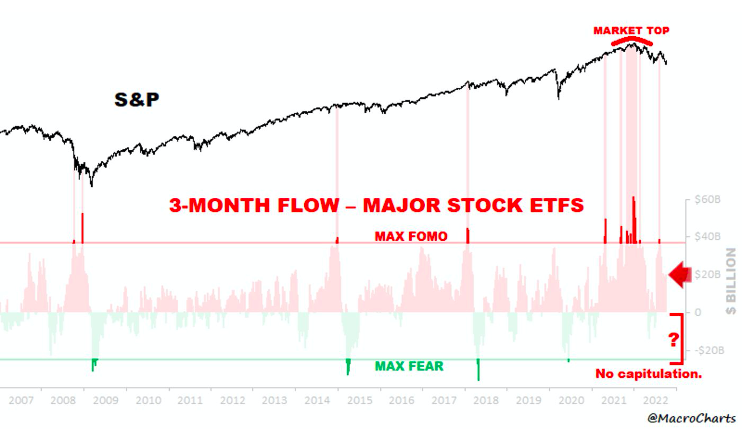
While the number of survey respondents expressing themselves as bearish is high (over 60%), they are not looking to get out of the market. Cash levels are notably lower than in past instances of trough markets. People are not looking to get out of the market as net flows into the equity market are still positive this year according to Bank of America. In fact, while traders may be positioned net short on the S&P 500 the Nasdaq is a different story; traders are still net long that index despite the carnage the Nasdaq and the tech sector have seen this year. Until despair leads to action I’d be skeptical about a bottom.
Figure 5: Investors May Say They’re Fearful But They Aren’t Acting Like It, Willie Delwiche and Macrocharts
3. Peak Margins
We opined in a past edition that investors would be wise to worry less about what the peak level in CPI turned out to be and contemplate more about the very real possibility that the equilibrium level of inflation going forward would be higher than the 2% we’ve seen and become accustomed to since the Financial Crisis.
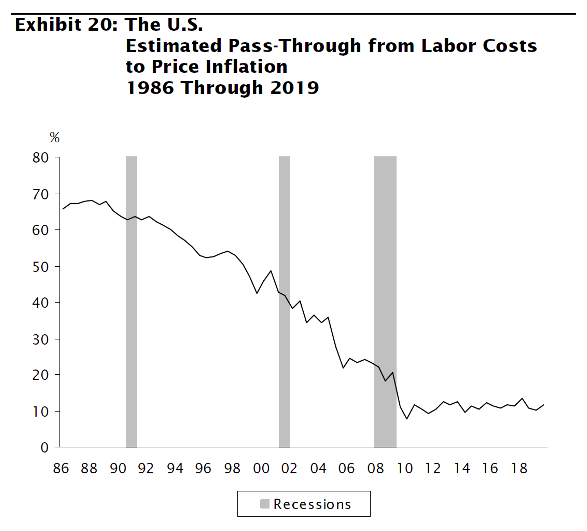
Maybe it’s a bit early to speculate on such things but there is a reasonable scenario where the next peak in the next cycle sees a noticeably lower margin profile for U.S. corporations. First, and as highlighted in the piece mentioned this summer, the labor picture is dramatically different going forward than the recent past. Supply of labor will be more difficult due to retirements and aging but also prime workers will get more expensive as they age and enter their peak earning years. It seems unlikely that labor’s impact on the general price level will be as muted going forward as in the past (Figure 6).
Figure 6: The Impact of Labor Costs on Inflation, Empirical Research
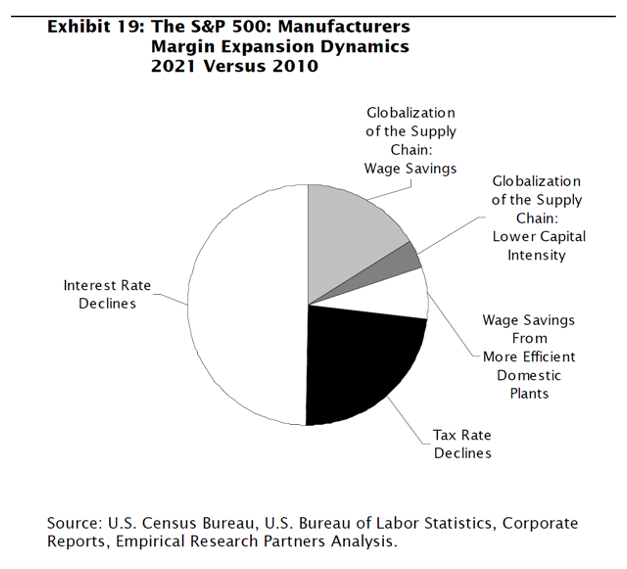
More generally, there are a number of forces that served as a tailwind for decades that threaten to reverse and become headwinds when it comes to corporate profitability and returns. Labor is obviously one of them. But there are others as well. The two biggest forces propelling S&P 500 margins have been declines in the cost of capital as well as tax declines, according to Empirical Research. It’s hard to see these two factors continuing to be a tailwind to boost bottom lines, let alone eating up a greater portion of income statements. Globalization led to more efficient supply chains, which helped lower costs, improve quality, and with less capital intensity and while I wouldn’t go so far as to be reactionary and say globalization is being undone, it is clear that political risk and matters of security are entering into where and how companies source products and not just about the bottom line.
Figure 7: Decomposing Margin Expansion, Empirical Research
Maybe this thought exercise is all for naught as productivity improves thanks to industrial automation or as technology continues to make up a bigger share of economic activity. Maybe the economy’s structure as being less energy or capital intensive outweighs higher energy and capital costs. But assuming everything will be the same on the other side of whenever the next recession comes doesn’t seem like a sure thing.
4. China and Chips
Two Fridays ago the Biden Administration’s Department of Commerce announced new rules and regulations pertaining to the semiconductor industry’s relationship with China. There have been several iterations of rules and regulations over the last five years and their bark has significantly outweighed their bite as loopholes were easily exploited, licenses freely given, and exceptions made.
This new set of rules is a substantial game changer. Their full ramifications will not be felt for many, many years. It is broader in scope, more technically detailed, and creative in structure than anything passed in the last few years and marks a serious escalation in tech tensions. Whereas past measures were aimed at slowing China’s technological advancements these new actions intend to stop its development dead in its tracks, so long as that development was dependent upon American products, tools, software, and personnel.
There are a number of compelling and insightful resources already covering the issue that we wish to link to as they do a better job than we could on the topic but expect this to be a future topic in the press and on our site for years to come.
- Choking Off China’s Access to the Future of AI by Gregory Allen at the Center for Strategic and International Studies
- Ben Thompson from Stratechery here and here
- New Chip Export Controls and the Sullivan Tech Doctrine with Kevin Wolf, Jordan Schneider and Irene Zhang at ChinaTalk
- Odd Lots Podcast with Dan Wang of Gavekal Economics