
1. Terry Smith and Quality
Terry Smith is known as “Britain’s Buffett” (Figure 1 shows why the moniker exists) and his annual letter is always an illuminating read. This year’s letter is no exception for its discussion on his investment philosophy, particularly on why quality matters first and foremost.
Figure 1: Fundsmith Returns

We’ve written before (here and here) about how there are more important primary considerations in securities analysis than what a ratio says. Smith’s letter this year provides another angle with the same point in mind. He lines up a broad mix of stocks from his portfolio and shows what kind of multiples you could have paid and still beating the MSCI World Index return of 6% per year since 1973 by 100bps.
281x for L’Oreal. 230x for Lindt. 174x for Brown-Forman. 100x for Pepsi. 55x for Clorox. You could have paid what initially look like absurd valuations and comfortably outperformed the market. Getting a share in these businesses for what the market was actually offering at the time was a downright bargain.
Making decisions by scanning PE ratios tells you nothing about whether or not a business is trading cheap or expensive. Some stocks deserve seemingly egregious multiples. Others deserve to always be cheap. Figuring out the reasons why is a far more helpful means of figuring out whether a stock is cheap than by quibbling a turn or two on a multiple.
Buffett once remarked that the three most important words in investing were “margin of safety.” It seems to me that if you nail the quality of the business, they may be one in the same.
2. Grantham Calls for a Bubble to Pop…Again
Jeremy Grantham is one of the largest and most influential market figures over the last 50 years, establishing one of the first index funds in the early 1970s. In the 90s and 2000s, he sounded alarms at excesses building up in Internet stocks and in housing. In January Grantham published that US markets are in the midst of a Superbubble on the verge of collapsing and heading to a ~50% decline. Volatility ensued over the next few weeks, especially in high-multiple, fast-growing names found in the Nasdaq and spilling over into broader indices.
Mr. Grantham has been making the same call year after year since 2010. It’s no surprise that there are plenty of people who are skeptical of this view. After reading the piece I can see why skepticism exists. The logic in the piece doesn’t flow well or is inconsistent in multiple places. It lodges accusations and makes claims with little if any supporting evidence or arguments
For instance, Grantham claims “Today houses in the U.S. are at the highest multiple of family income ever, after a record 20% gain last year, ahead even of the disastrous housing bubble of 2006.” There’s no data or charts in the piece to support the claim. A quick Google search of Bill McBride’s work (the best on the housing market and also someone who rang alarm bells pre-2008) shows affordability is nowhere close to the highs prior to the GFC.
Figure 2: Housing Affordability Is Much Lower Today than 2008, Source: Bill McBride

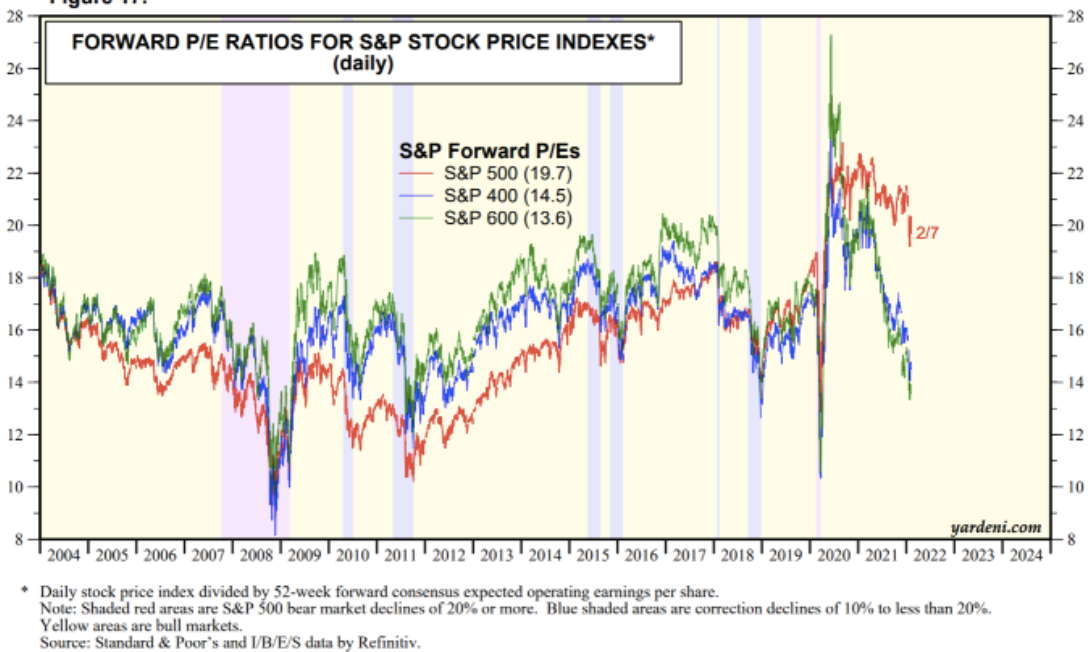
There are other claims about US equity markets being in a 2 sigma or 3 sigma type of environment, so overextended that a reversion to the mean will be painful. Yet, again, there’s no evidence, data or analysis to support the claim. There’s nothing about why extreme monetary or fiscal policies in the US have the US in a Superbubble and yet why those same measures haven’t taken us to the same extremes in Europe or Japan. It ignores the fact that Mid and Small Cap stocks trade at 14.5x and 13.5x earnings and grow much faster than large cap stocks.
Figure 3: Mid and Small Cap Stocks Are Not Expensive, Source: Yardeni
There’s plenty more to pick with the logic of the piece. And yet, Grantham may still be right. By any measure, investors are not sitting this market out and they are so invested that finding a marginal buyer is tough to conjure, especially during a tightening cycle. Historically, these levels of positioning spell for terrible long-term returns and at least one crescendo of pain that people point to.
Figure 4: Household Equity Allocations Are At Their Highest Since the Internet Bubble, Source: Ned Davis

There’s a saying that being early is the same as being wrong. What about being right for the wrong reasons?
Speaking of bubbles…
3. Bubbles Don’t Pop at Once
Grantham’s piece and others remarking on the current market being a bubble made me look back at what the path of the Nasdaq’s decline looked like at the turn of the century. There are quite a few parallels to that time 20 years ago: an obsession with unproven technologies and hollow promises off into the future, a retail market craze, a tightening cycle, etc. Whether or not this market meets the amorphous definition of a bubble is beyond the scope of this piece but in looking at the Nasdaq’s collapse one thing is very apparent: bubbles do not pop at once.
Figure 5: The Nasdaq’s False Starts
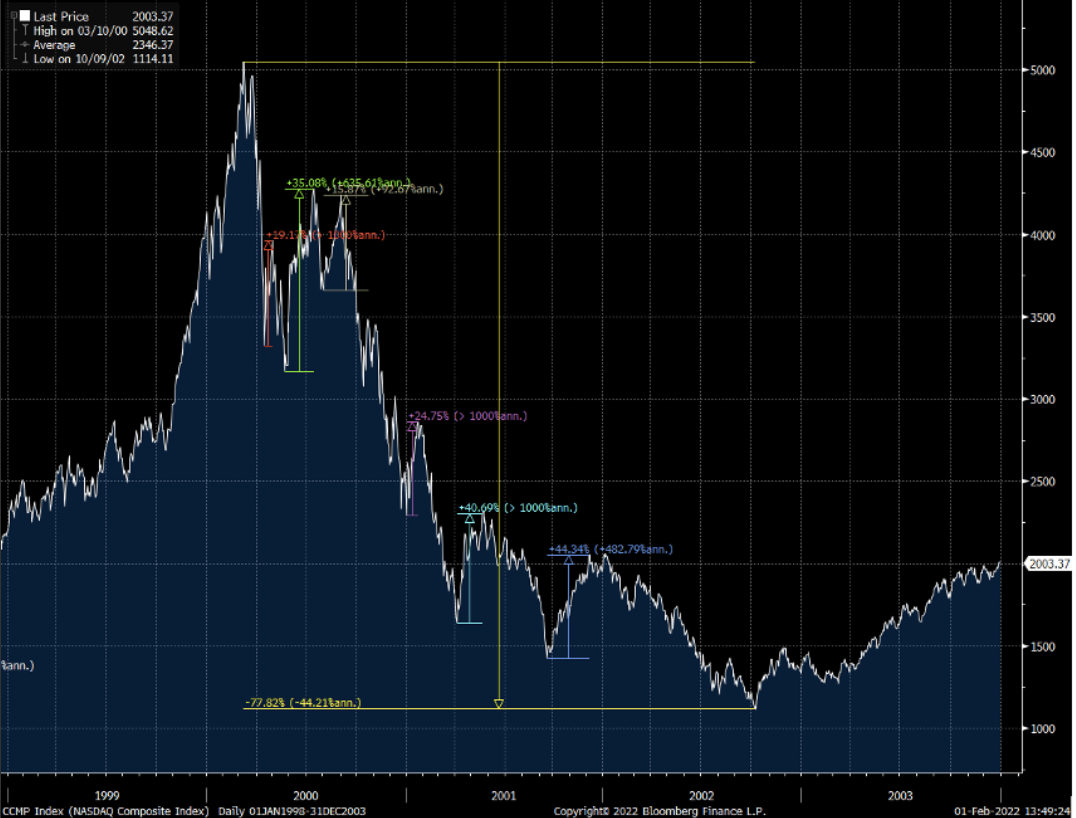

The Nasdaq declined over 75% from peak to trough. Yet in between, you got multiple bounces of 40%, one north of 30%, and other substantial short-term recoveries. Any one of these would have had people thinking whether the worst was behind them, and understandably so. Yet each one was a chance to sell gains instead of buying back in. It would have put even a disciplined investor’s psyche into a pretzel.
Whenever an unwinding of the current market positioning comes, odds are investors will think “it can’t go any lower” before it does.
4. Fed Hikes and Credibility
Bill Ackman publicly stated that in order for the Federal Reserve to restore its credibility it needs to pursue a policy of “shock and awe” by making its first rate hike in March a 50 basis point move instead of the standard 25 basis points. The theory is that by surprising markets out of the gate the market will not worry about the Fed being behind the curve and will keep inflation expectations in check. It’s an understandable theory given how hot inflation has been the last several months and that it will not be slowing down in the next handful of data points, all with the Fed standing pat.
Yet, if anything, the Fed’s credibility isn’t an issue. At least not at the moment. Just look at the market. Currently, breakeven inflation rates show that the bond markets are totally bought into the Fed and have total faith in the central bank getting inflation under control.
Figure 6: The Market Believes the Fed is in Control
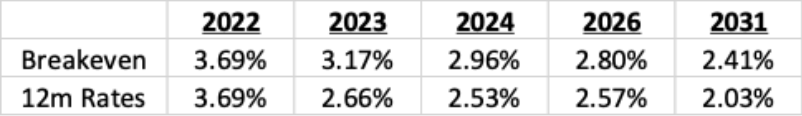
Breakeven inflation rates show inflation getting under control with 5-year breakevens showing an average inflation rate over the period of 2.8%, much lower than today’s rates and, while higher than recent history, a perfectly manageable level. Some basic math however shows even more reason for optimism. One can calculate, based on these public breakeven rates, the implied inflation rate anticipated by the bond market for tenors in between the traded securities.
For example, with 1 year breakevens at 3.69% and 2 year breakevens at 3.17% one can back out the implied inflation rate for just the second year. The results show that the bond market is forecasting inflation for the calendar year 2023 of 2.66%, far from any levels that show the Fed’s credibility is being questioned by the bond market.
Things can change of course but the real test for the Fed will be whether they stick to a plan to tame inflation in the midst of profound market volatility. At the moment, the bond market believes they will.