
The Wooden Nickel is a collection of roughly a handful of recent topics that have caught our attention. Here you’ll find current, open-ended thoughts. We wish to use this piece as a way to think out loud in public rather than formal proclamations or projections.
1. Labor Market Strength
“The economy won’t break until the labor market does.” The statement is a frequently cited adage in economic analysis and there is a good deal of truth to it (see here for example). With Disposable Incomes currently rising between 3 and 4% after accounting for inflation, the consumption machine can keep humming along.
“Unemployment is a lagging indicator” is another such axiom as demonstrated here and here. Layoffs don’t necessarily happen at the first sign of weakness. After all, finding and training employees is a difficult and expensive endeavor. So, cutting workers today has to be worth both any severance, if applicable, but also any incurring incremental future expenses when the climate turns more favorable at some point in the future. As a result, when layoffs do show up in macro data, it’s usually well after the peak in economic activity.
But there are ways to get a more real-time look at the strength of the labor market or employer’s demand for labor. Some like using job postings aggregated from a variety of sources to show demand for labor but many are incomplete, stale, or inaccurate.
A more holistic approach is to look at the money flowing into the US Treasury Department on a daily basis which shows payroll taxes withheld from paychecks. The data over the last quarter hasn’t just been encouraging, it suggests that the strength of the labor market and the consumer has been accelerating.
Figure 1: Withheld Taxes Suggest Labor Market Strength, Source: US Treasury Department
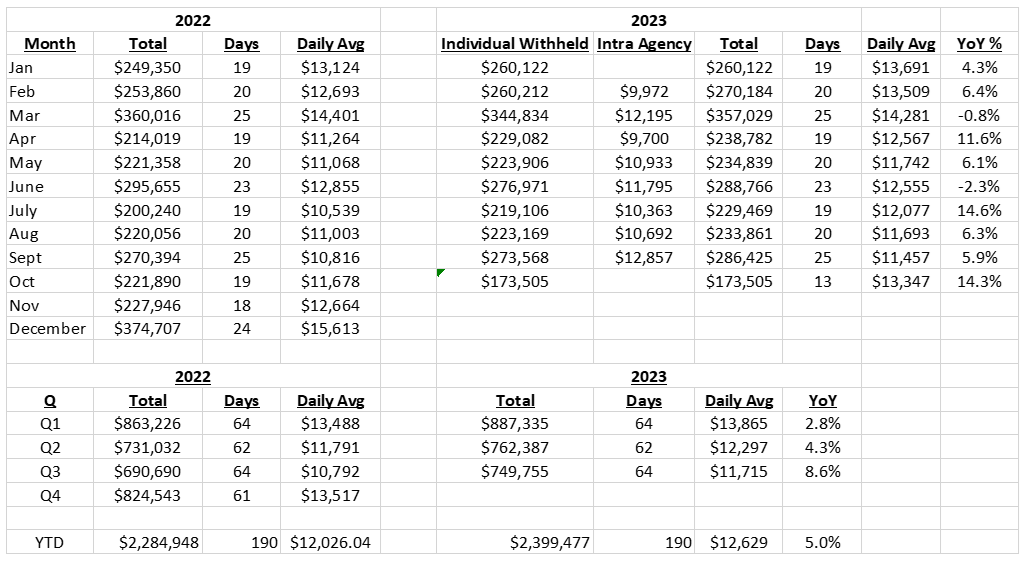
Figure 1 lists daily averages for each month for 2022 and 2023 and aggregates them for quarterly and YTD figures (the number of days is adjusted for holidays). Not only are the growth rates healthy, but they are accelerating with Q3’s growth rate faster than Q2 and at very high overall levels. Further, the rising level of withheld incomes and acceleration corresponds with inflation slowing markedly over the same time period, meaning that inflation is not artificially lifting figures. Some level of growth is not surprising. After all, as the monthly jobs reports show, more and more people have jobs than they did a year ago. But the acceleration demonstrated this late into an economic expansion conflicts with other economy wide indicators like the ISM or LEI. It also suggests that labor is seeing higher and higher pay raises.
Figure 2: GDP Now Estimates for Q3
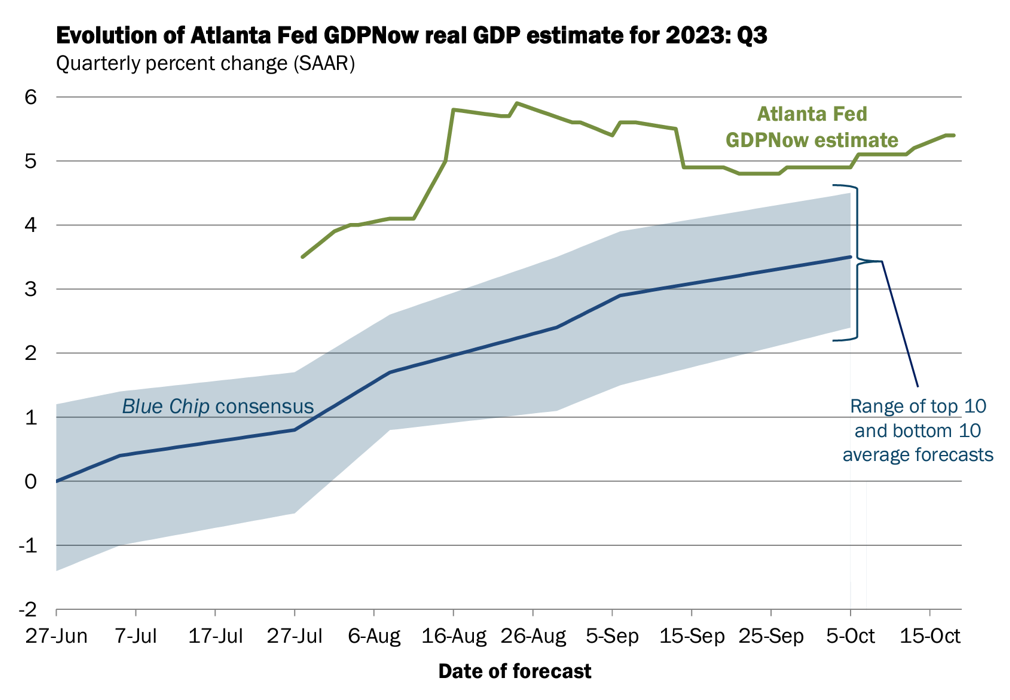
After all, if you run out of workers to hire, you have to pay more for your current employees and any new hires. It’s no wonder that Q3 estimates for GDP growth have gone from literally 0% to some of the best rates post-GFC.
2. Inflation Headwinds and Tailwinds
Rising oil prices throughout the month of September reignited fears of inflation accelerating in the latter part of 2023 and into 2024. Production cuts by Saudi Arabia and Russia sparked a rally in crude of nearly 20%, and that was before Hamas’ deadly attack on Israel earlier this month. Central bankers in Europe as recently as last week openly discussed the prospects of rising energy prices necessitating more rate hikes.
It’s not an unreasonable concern. Oil, and its byproducts, are more ubiquitous than most realize, so a substantial rise in the base commodity does have downstream impacts that affect all parts of the economy. A further reason for concern is the fact that prices were much higher not too long ago, nearing $120 per barrel last year. Even though oil in the $80s, as it sits today, is higher than most of the post-GFC era, it occurred with the weakest Chinese economy in a generation and Europe in recession. Resilience in the US economy provides a floor while a pickup in the other large economies of the world could take prices near or beyond those seen last summer.
To put some numbers on it, if the energy subcategory of CPI were to simply reach its levels of last year while simultaneously increasing its size in the CPI basket (Energy’s weight in CPI fell from over 9% to just over 7% since last summer), then that would easily be enough for another 150bps -200bps in inflation levels, if not more. That puts us back in the 5%s easily.
Again, it’s not an unreasonable set of beliefs in terms of level and catalysts. But it’s an incomplete view of what’s coming for CPI. A double-whammy of rising energy prices and a higher product weight in CPI isn’t anything to ignore, but it pales in comparison to the rollover in housing, apartments, and shelter pricing. Compared to energy’s 7% weight, shelter makes up 40% of the CPI, and while the housing market peaked last year in terms of market rents and sales of new and existing homes, the impact to the Consumer Price Index possesses an enormous lag (Figure 3).
Figure 3: Shelter CPI’s Significant Lag Compared to Real-Time Pricing
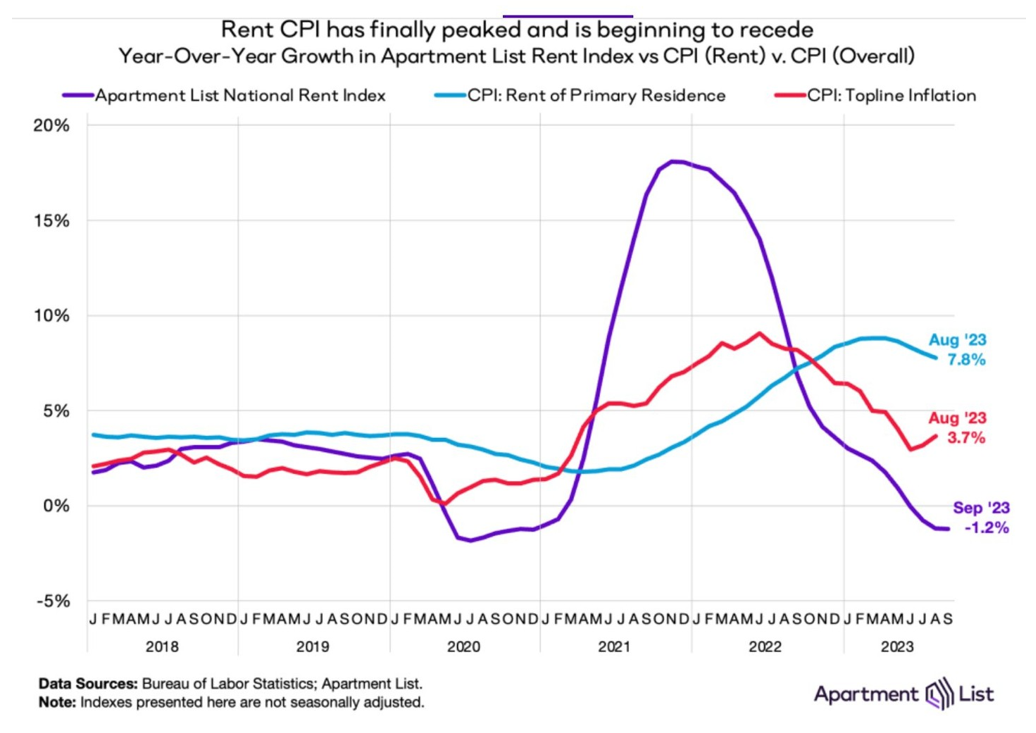
The ~18 month lag and magnitude of decline to come to Shelter within CPI is likely to put some cap on CPI rising back to levels we saw in 2022 in the near term. That’s obviously different from guaranteeing back a path back to 2%.
3. Inflation Estimates
It hasn’t just been investors and economists who have struggled to digest and forecast inflation over the last couple of years. The mighty bond market, which has a reputation as being the “smart money”, has struggled mightily to digest and discount the pace of inflation during the COVID boom. Short term TIPS, bonds that have their principal adjusted for changes in inflation, offer protection from accelerating rates of inflation, at least in theory. Whenever an investor buys a TIP they lock in not only their yield, much like any other bond, but an embedded rate of inflation assumed for the forward period. In the past couple of years though, that assumed rate of inflation has been wildly off the mark.
Figure 4 charts breakeven inflation rates, calculated as the yield on 1 year bonds minus the yield of 1 year TIPS (blue). In orange is the actual level of inflation that occurred over the following 12 months. To put an example on it, in the summer of 2021 breakeven rates were forecasting inflation over the next year to be ~3.4%. It actually ended up close to 9%. The difference between the two measures is visible on the next chart as well.
Figure 4: Inflation Has Been Underpriced Much of the Last Two Years
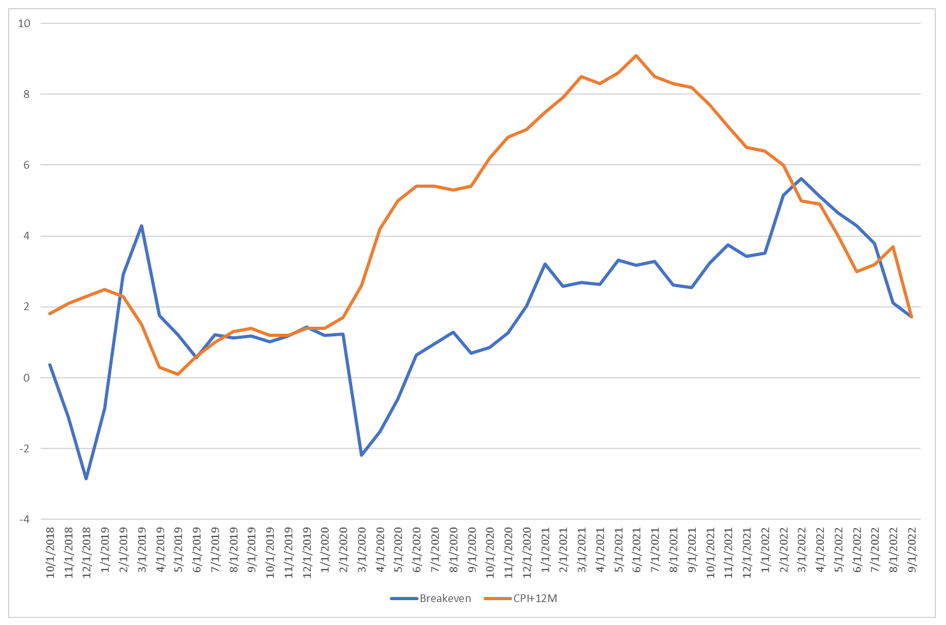
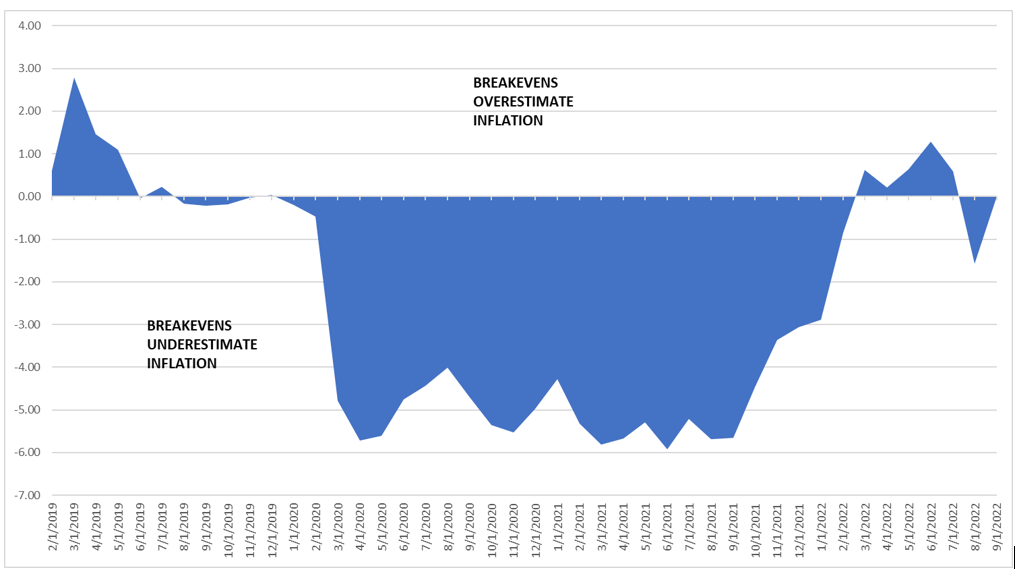
Given the economic and market context of the period involved, it’s premature to jump into the idea that there is some sort of inefficiency embedded into TIPS that could be reaped on a recurring basis; TIPS have their own idiosyncrasies that prevent a perfect apples-to-apples comparison and investor base. But the magnitude of underpricing that occurred over the last two years is notable.
It’s often said that investors, and people in general, overestimate what can be done in a year and underestimate what can be done in a decade, referring to innovations and technologically induced disruptions. More generally, a similar axiom could be that investors and people struggle to think beyond rangebound changes in norms. Too often we think of what the future holds by looking at the typical, the average, and then moving out from there. The risk is that moves of multiple degrees and deviations never enter our minds as a possibility.
4. Bond Spreads
While there are plenty of voices expressing concerns over what impact the ferocious rise in interest rates and bond yields will have on the economy, one place where there is no concern (yet) is the bond market itself.
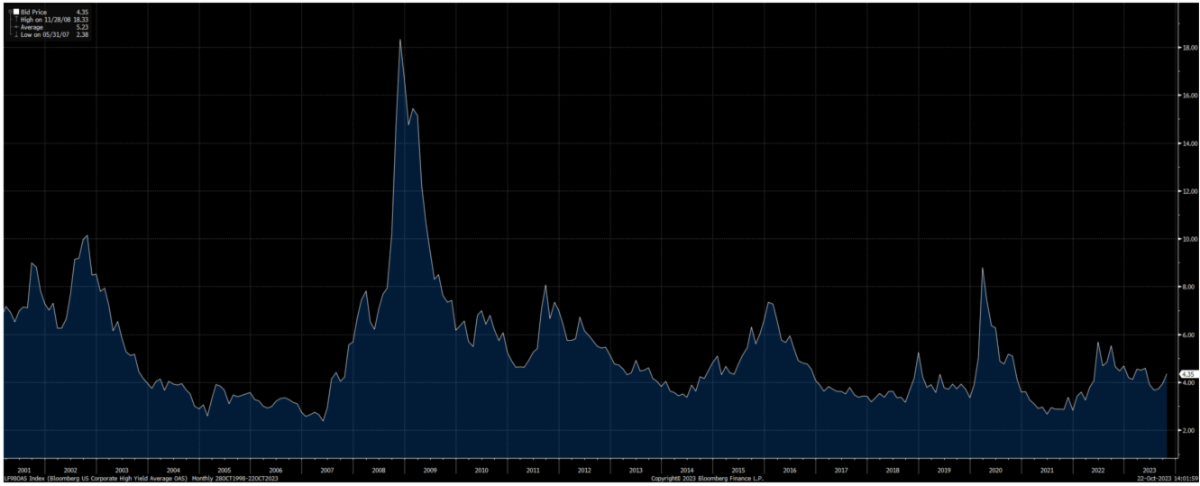
The simplest way to check to see if the market is pricing in increasing amounts of credit risk (i.e. debts not being paid back) is to look at the difference between benchmark US government bonds and other sections of the bond market, whether corporate, high yield, mortgage, or business loans. And right now, any sort of fears are essentially nonexistent.
Figure 5: Corporate Bond Spreads Are Muted
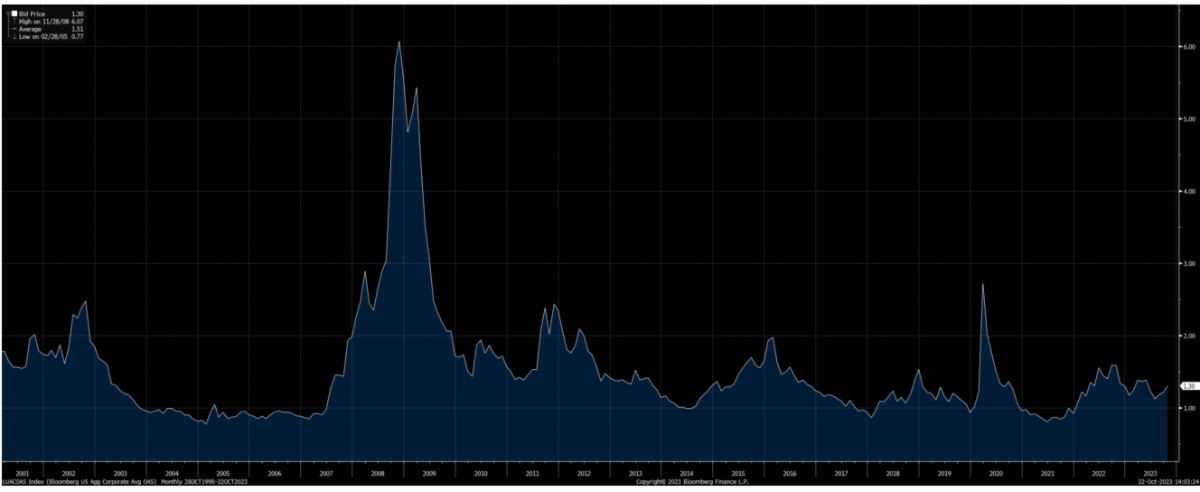
Figure 6: So Are Junk Bond Spreads
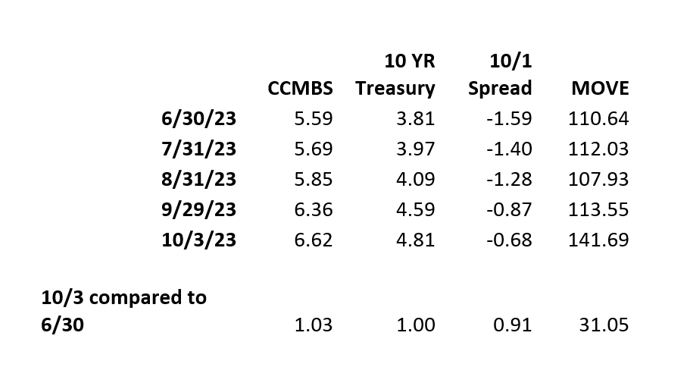
Even Commercial Mortgages haven’t been budging. In the last 4 months, essentially, the entire increase in Commercial MBS rates can be attributed to corresponding moves in risk-free Treasury rates. We have looming maturity walls, refinancing needs, work from home, and commercial office pressures, but none of them have been able to force a budge in the spreads of these bonds.
Figure 7: Even Commercial Mortgages Are Quiet
5. Recommended Reads and Listens
- The Damped Spring Report – An excellent commentary on how the market has unfolded the way it has the past year, the catalysts driving it now and in the future, and a forecast for how this ends. A few months old but extremely prescient in multiple ways.
- September Inflation Recap
- Where Are All the Defaults?
- Charles Schwab: The 8 Trillion Dollar Gorilla
- Some Thoughts on Charles Schwab
- NAV Loans: Canary or the Gold Mine
- Is There Risk of Another Energy Crisis in Europe?