
The Wooden Nickel is a collection of roughly a handful of recent topics that have caught our attention. Here you’ll find current, open-ended thoughts. We wish to use this piece as a way to think out loud in public rather than formal proclamations or projections.
- The Credit Cycle
In the aftermath of the Silicon Valley debacle, there has been ample commentary stating that with such a large bank failure lending standards and credit are certain to tighten, choking off credit to the economy. With money market funds offering rates in the mid 4% range and 3-month bills yielding over 5%, banks would have to increase the, on average, sub 50 basis point deposit rates to hold on to deposits; especially now that they’ve seen a classic deposit run end the fastest growing bank of the last several years. Lending standards would simultaneously tighten to preserve balance sheets that have seen their bond portfolios take a hit with rising rates. This duality would choke off available capital to lend out and grind the economy down.
SIVBs collapse as the canary in the coal mine is a counterfactual that can’t be proved but the odds are that some form of credit tightening was due to come our way regardless. In Figure 1, we have the 2s-10s yield spread (orange and left axis) charted against the growth rate of loans from the commercial banking industry (blue and right axis) through March 24th of this year; recessions are shown in gray bars.
Figure 1: The Yield Curve and Credit Creation
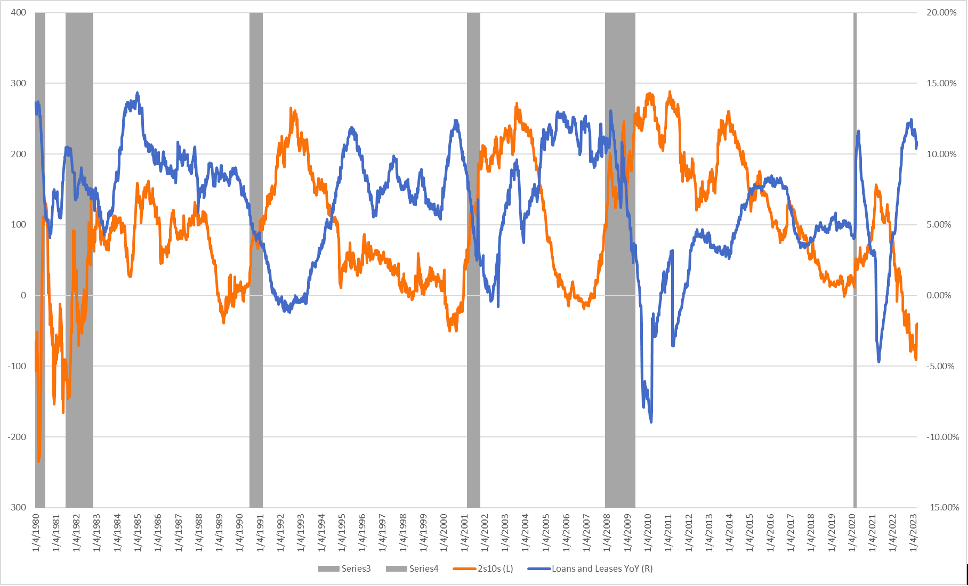
The relationship presented in Figure 1 shows a pretty clear relationship: when credit growth peaks, there is a substantial deceleration 12-18 months later with loans and leases growth falling to below ~5%, or below Nominal GDP, essentially shrinking economic activity. When you add the conditional starting condition of an inverted 2s-10s curve, the predictive strength only grows: credit growth decelerates and usually goes negative but, more starkly, a recession happens each time. Considering that loan growth peaked in Q4 of 2022, months before SIVB, (and it being exceedingly unlikely it will reaccelerate from here) it seems that credit growth was headed down the path of its historic analogues regardless. Unless you believe things are just different this time…
- Banking Dominos
Financial markets have a history and propensity of playing dominos, moving from one problem to the next. For those with memories of the GFC and the peak of the European Debt Crisis, they’ll remember how “contagion” became a central theme. The present stresses on the deposit side of banks’ balance sheets have brought into focus the asset side as well, specifically commercial real estate tied to office exposure. While Regional Banks have seen their stock prices fall over 35% so far year-to-date, Office REITs have also fallen over 17%.
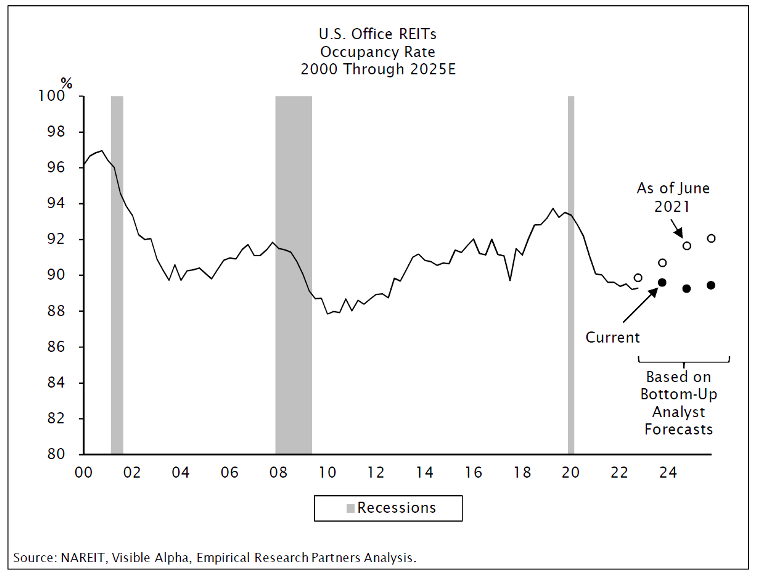
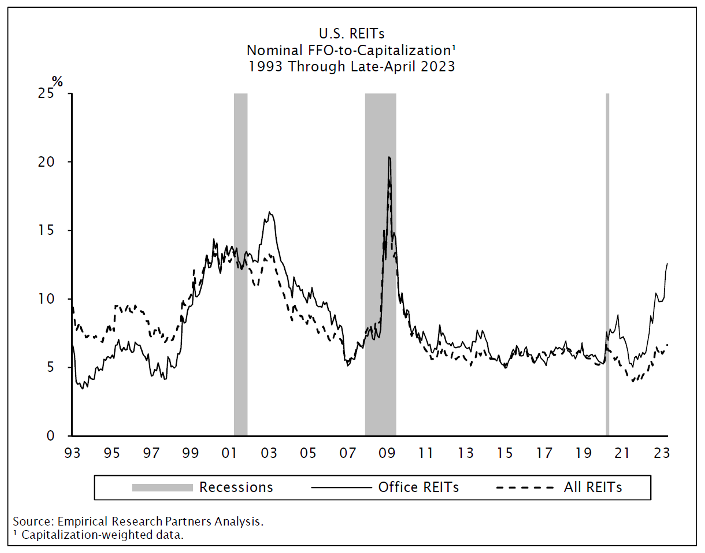
Office REITs are facing the dual problems of tightening credit markets and a fear that demand for office space has been permanently impaired from historical rates due to the habits unleashed by the pandemic. In the last 30 years the only times Office REITs have traded any cheaper than their present valuations were the nadir of the dot com bust and the GFC.
Figure 2: Estimates on Occupancy Fear See No Improvement for Years, Pushing Valuations to One of the Lowest Points Ever, Source: Empirical Research
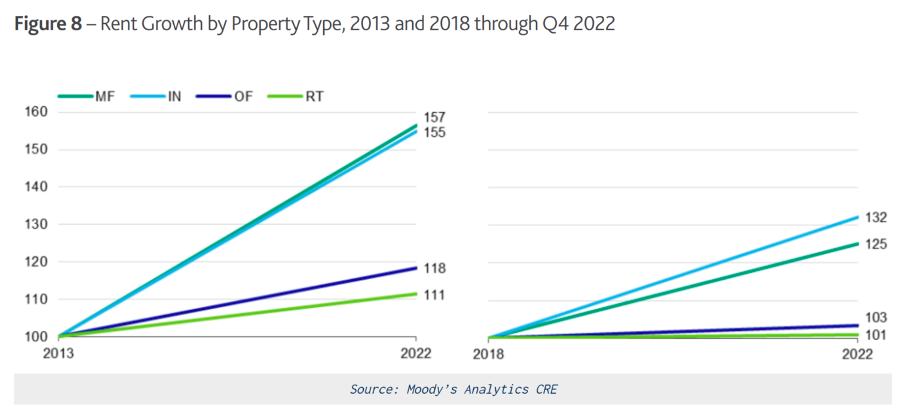
Weak demand for office space means landlords and property owners have to compete over a smaller pie, lowering rents. If the income impairment is indeed chronic then property values must come down, deteriorating their collateral value. And even if credit is secured, it comes at a time when financing costs are their highest in over 15 years. Normally, this kind of strain could be relieved, if at least partially, through rising rental rates. However, office space hasn’t had the kind of pricing power that other real estate sectors have had, even before the Work From Home era (Figure ). Rent growth from 2013 to 2022 even lagged the CPI.
Figure 3: Office Pricing Power Has Been Weak, Source: Moody’s
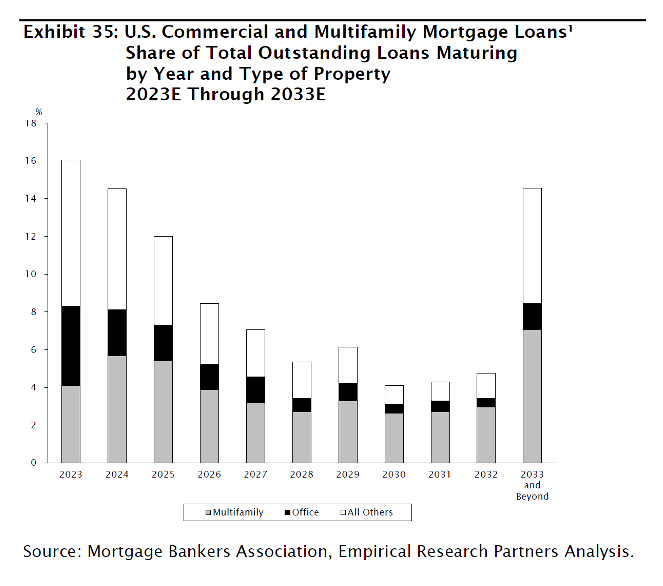
For banks, the concern with a weak office market is twofold. First, the underwriting risk in a sector that some believe has secular pressure never had much pricing pressure to begin with. At a time when bank balance sheets are under extra scrutiny and capital is expensive, underwriting incremental capital against a pressured sector may be something banks don’t have the appetite for. Banks already have substantial credit risk exposure to Commercial Mortgages (Figure 4). Second, there is the risk of default especially if the economy worsens over the next couple of years. There is much less leverage involved in this real estate market than in the one preceding the GFC so investors shouldn’t quite fight the last war (Figure 5). But approximately 30% of mortgage loans are due to roll over in 2023 and 2024 (Figure 6). Defaults have already started to rise and have even captured some of the biggest investors and landlords in the world.
Figure 4: Banks Have Large Exposure to Commercial Mortgages, Source: Empirical Research
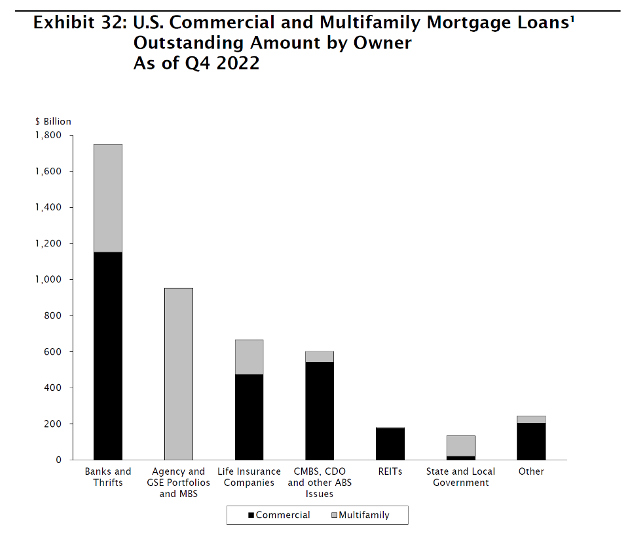
Figure 5: LTVs are Much Lower Than Pre-GFC, Source: Moody’s
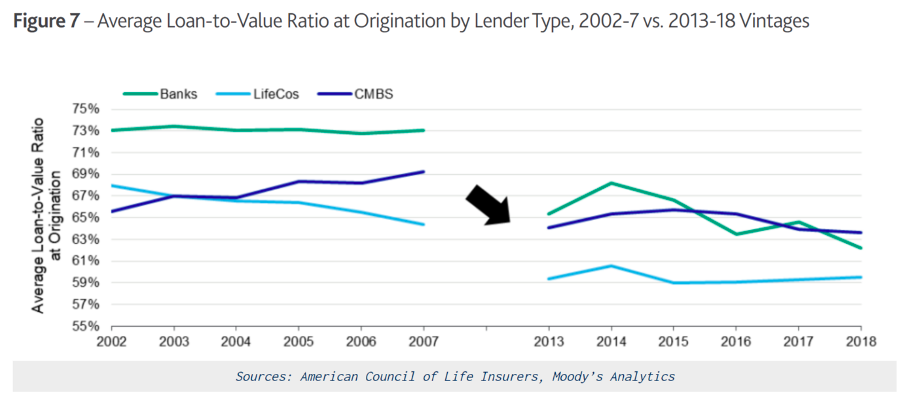
Figure 6: 30% of Commercial Mortgages Are Due Through 2024, Source: Empirical Research
3. De-Dollarization: Where Hysteria and Laziness Collide
“It’s better to keep your mouth shut and appear stupid than open it and remove all doubt” – Mark Twain
Fascination over global currency reserves and the primacy of the dollar are back in fashion. It seems every wave of hysteria that gets explored over the years crests with arguments that increase in laziness and stupidity. And unfortunately, even major players and voices get caught up in it.
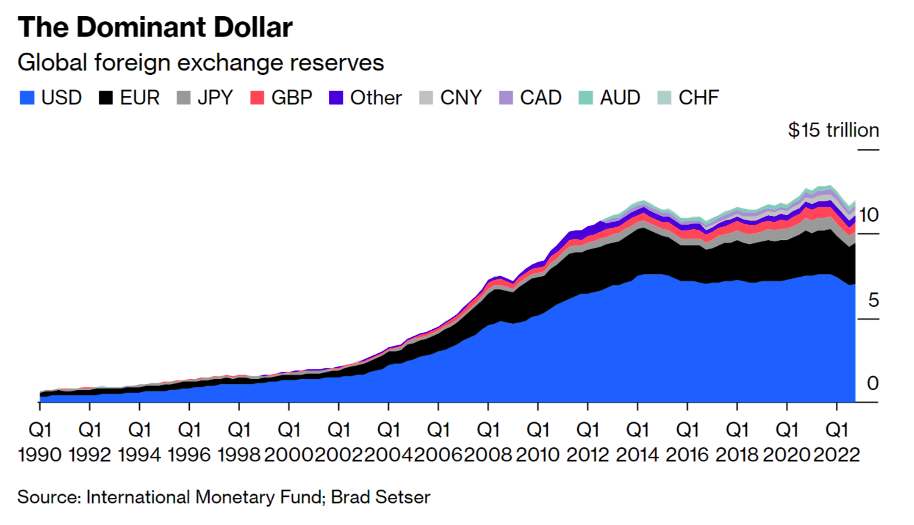
Take a recent piece from Morgan Stanley, as highlighted in the Financial Times. According to the FT, the dollar’s share of global reserves fell from just over 70% twenty years ago to 47% last year, per a Morgan Stanley economist. The figure and paper made waves up and down financial media from doomsayers, fear mongers, and the ignorant. It turned out to be wrong and fantastically so. As chronicled by Brad Setser at the Council on Foreign Relations there was zero change in the dollar’s share of global reserves in 2022 (Figure 7). The original author had failed to account for the fact that bonds held by foreign central banks had fallen in value as interest rates rose. In other words, global owners of dollars did not sell as was implied in the Morgan Stanley piece. Furthermore, the piece completely excluded the positioning and role of state-owned banks, sovereign wealth funds, and derivative contracts which are frequently used to hedge out currency exposure from net exporters (i.e. not the US). Including the full landscape not only shows the dollar is nowhere close to losing its dominant position, it actually shows that foreign demand for dollars and dollar assets increased in 2022. The dollar’s share has held steady for decades, fluctuating here and there as different players (mainly sovereign wealth funds) intentionally reduce purchases when the dollar is expensive and increase them when the dollar is cheap. At the end of the day, the paper was an error of comedic proportions.
Figure 7: The Dollar’s 2022 Demise Was Totally Nonexistent, Source: Brad Setser CFR
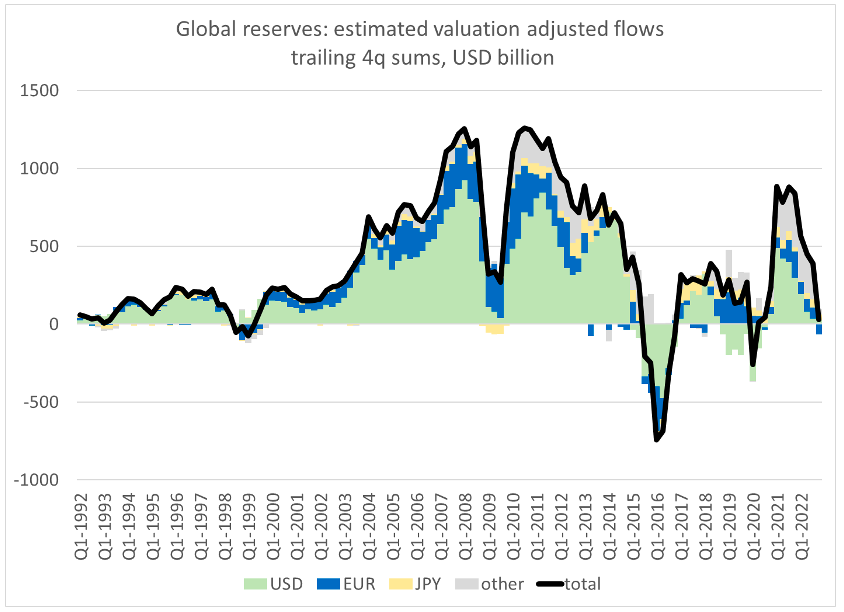
Figure 8: Demand for Dollars Rose in 2022, Source: Brad Setser, CFR
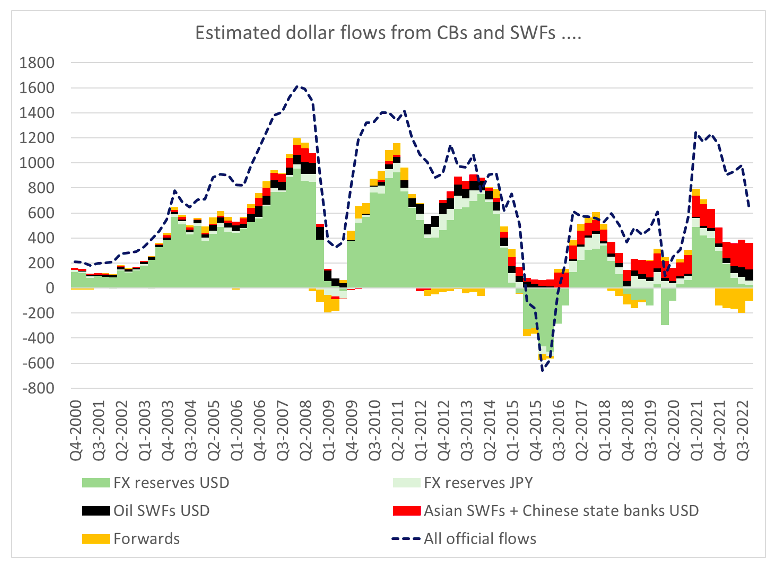
Figure 9: On A Longer Time Horizon The Dollar’s Role is as Strong as Ever
It always strikes me as hilarious to read these doomsday proclamations on the dollar and yet no one seems to ask about the Euro. As Larry Summers once joked, Europe is a museum, Japan is a nursing home, China is a jail, and Bitcoin is an experiment. And yet no one seems to look at the Euro and Yen, see that their shares haven’t budged for decades, and think that maybe there’s something else that goes into reserve share beyond debt levels, GDP growth, or any other measure.
One of the principal misnomers on this topic is that there is some sort of relationship between trade flows (and what those invoices are denominated in) and a harbinger of reserve status. Stories like this between Iraq and China play a role in the thought process. Unfortunately, it’s completely irrelevant and there is no connection between what currency trade invoices are denominated in and reserve status. None. Trade can be denominated in whatever currency is desired by either party. What matters and what determines reserve status is where that flow of value ends up. It doesn’t matter how many steps are in between if the end result is that they end up in dollars anyway.
So why do deals like this happen? I think the reasoning is simple and exemplified with recent evidence from Argentina and its dire economic situation. Access to other currencies is made in order to preserve scarce dollar reserves, not to move away from them.
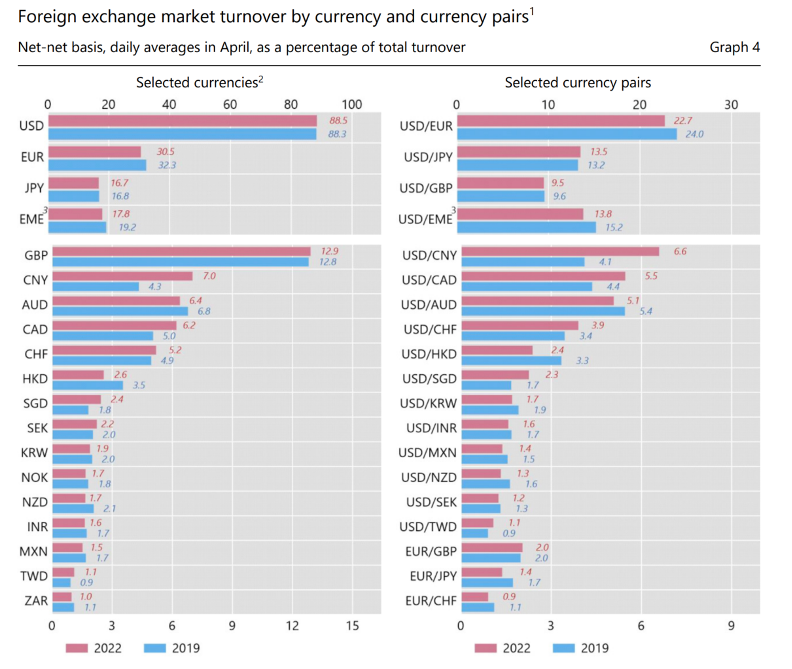
The Bank of International Settlements runs a survey every three years on the usage of different currencies. The results speak for themselves.
Figure 10: The Dollar’s Share of Invoicing Increased in the Last Three Years and is over 88%, Source: Bank of International Settlements
What people continue to fail to realize is that the dollar’s present status as a reserve currency is far more due to active choices and desires among global economies than it is the U.S., China, Russia, and other global exporters require that someone offset their intentionally export-driven economy and the current account surpluses that result with a current account deficit. Surpluses somewhere must be balanced by deficits elsewhere and the U.S. is by far the largest player in being able to balance the global economy. People can (and should) debate about whether the degree of imbalance is healthy (most likely it is not) but ignoring the explicit policy and structural choices made by those export-led economies cannot be overlooked. They, chief among them China, have intentionally depressed demand in order to grow faster, and at every fork in the road continue to lean into the same investment and export-led growth model of the past twenty years. As a result, their dependence on the dollar and U.S. deficits only grows.
Not only must China and other exporters have another party offset their intentional surpluses, but they also need someone with an open and flexible capital account. Hence another reason why China cannot and should not be taken remotely seriously as a reserve player. To bet on the RMB as a serious reserve player in the next several years is to bet on a more open, liberal, accessible, and rule of law driven China. Actions from the last few years demonstrate that the CCPs desire for control over its economy and financial system has only increased. Betting on that to change would take a serious turn from the party as well as decades of reform.
In between now and then you’ll be greeted with more hysteria just as in 2004, 2006, 2007, 2011, and 2018.
4. Debt Ceiling Drama
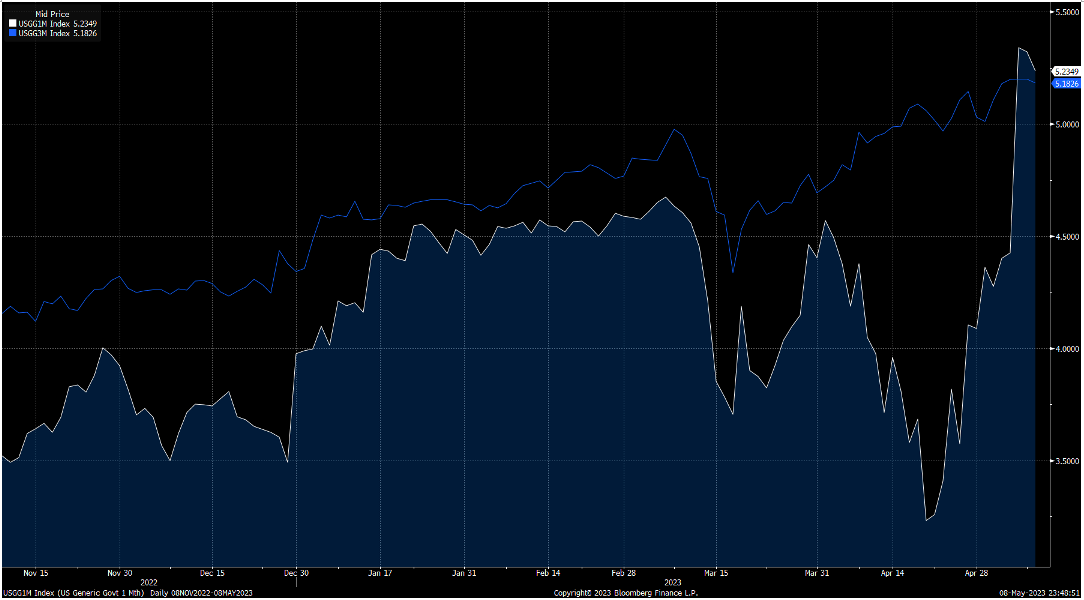
Near-term fears over the debt ceiling have accelerated dramatically, catalyzed by Treasury Secretary Yellen’s statement to Speaker McCarthy that the Treasury may run out of measures to pay the nation’s bills by June 1. The date sparked many by surprise; a Goldman Sachs analysis just days before had estimated cash would be sufficiently available into late July. One-month bills have sold off substantially, sending yields well over 5% and higher than 3m securities (Figure 11).
Figure 11: 1M Bills Have Seen Yields Soar
The June 1 deadline is indeed surprising. Tax receipts are updated constantly on the Treasury website allowing for private sector estimates to track pretty; Goldman’s analysis was seconded by a Deutsche Bank estimate for late July as well.
Further, in the last 10 years, the average fiscal deficit for the month of May has been just north of $140B (Figure 12).
Figure 12: Deficits By Month
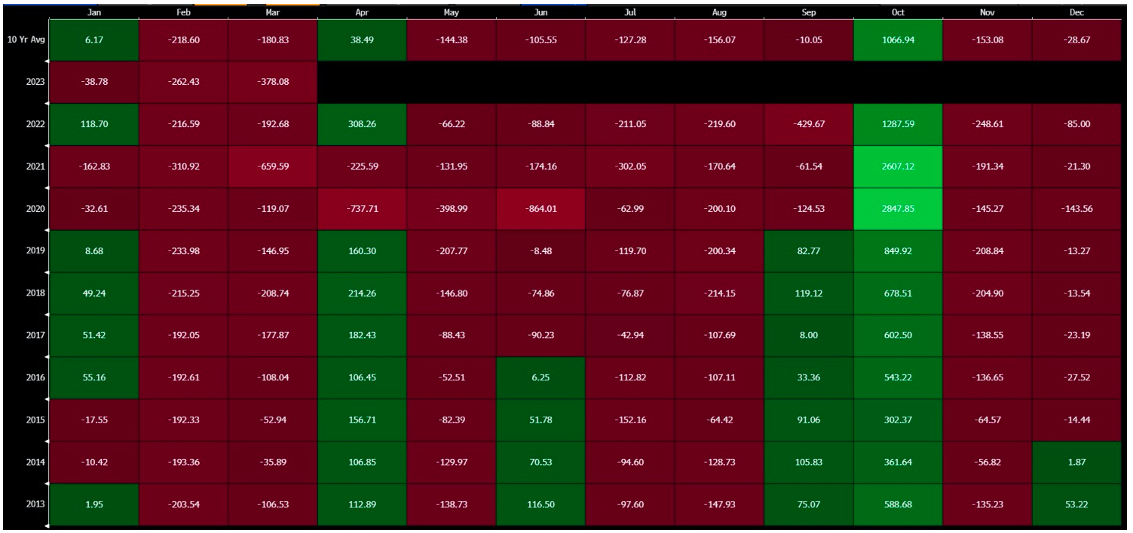
Considering that there is still over 270B still in the Treasury’s General Account at the Federal Reserve, it would seem there is ample cushion to cover even an extreme shortfall. In fact, the only year this wouldn’t have been enough was in 2020 when the economy shut down due to Covid.
Further, on June 30th , the Treasury has access to a one-time measure (as empowered by Congress) to not reinvest maturing securities from the Civil Service Retirement and Disability Fund and dedicate those funds to debt payments. This measure is worth just over $130B, and would be enough to cover July, most of the time, per the table above.
The late July/early August timeline thus makes the most sense for a realistic line in the sand when it comes to the debt ceiling, and the Treasury Secretary’s position may be more posturing than anything. But this is not an area of expertise, so we’ll annotate the axiom and say it’s a “weak idea, loosely held” but the best we can muster currently.