
The Wooden Nickel is a collection of roughly a handful of recent topics that have caught our attention. Here you’ll find current, open-ended thoughts. We wish to use this piece as a way to think out loud in public rather than formal proclamations or projections.
1. Short-termism is Alive and Well
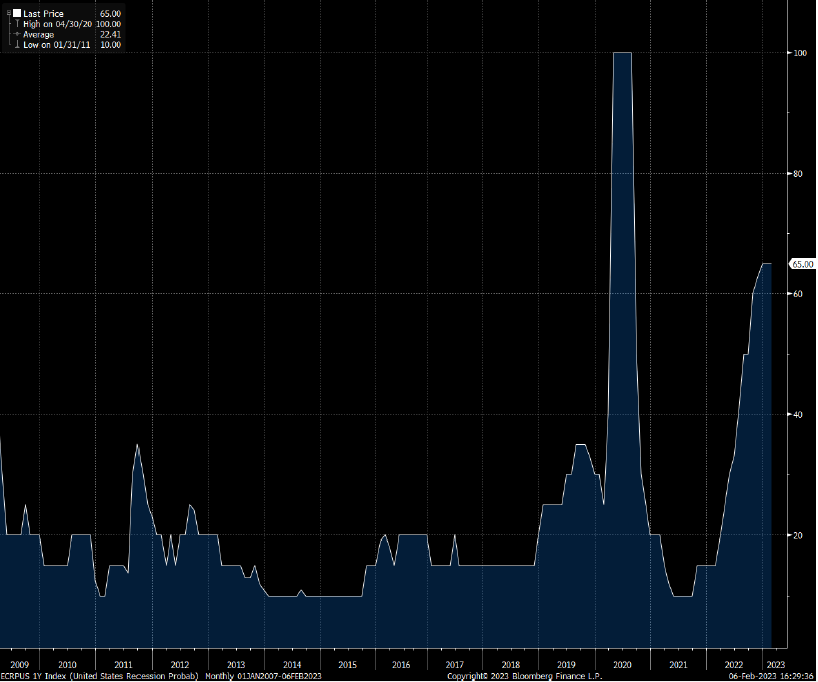
The best high frequency contra-indicator on recessions may very well be Wall St’s forecasting of them. The current 2/3 of forecaster’s that believe a recession will occur within 12 months is the highest since the Financial Crisis (excluding the impossible to forecast Covid recession).
Figure 1: The Most Forecasted Recession
The balance of fundamental economic data and market has certainly been mixed, at best, for several months. 2.9% GDP growth for Q4 2022 looks great on the surface but the boost of inventories belies the actual underlying demand. Housing has fallen off a cliff.
Retail sales have been weak lately but spending on discretionary items like leisure travel and entertainment have been exceptionally strong. The LEI has been negative for 6+ (an excellent harbinger of recessions). But these data points are not mutually exclusive proxies with an expanding economy; they can coexist and at the moment that is exactly what is happening. And last Friday’s jobs report in the U.S. should serve as the ultimate arbiter on the imminence of a recession. Businesses don’t ramp hiring if they can see the recession.
Goldman Sachs is already lowering their (prior low) odds of a recession in the next 12 months from 35% to 25% in light of the jobs report from last week and more and more economists and prognosticators are raising the odds of a soft landing for the economy in 2023. Predicting a recession is hard enough; obsessing over forecasting the exact timing is foolish and both the onslaught of predictions and those signaling that all is well seems extremely reactionary.
The unconditional probability of a recession in any given year is 15%, per Goldman Sachs and forecasted odds didn’t meaningfully cross that level until late summer, after the yield curve had meaningfully inverted. The inversion of the yield curve and a negative reading of the Leading Economic Indicators Index have extremely strong forecasting records. But they say nothing about when the recession hits. Given the global tightening cycle, geopolitical headwinds out of Russia impacting Europe, and how China has been held down for months it is understandable that people are jumping the gun in giving the all clear signal after strong recent data points on employment and inflation cooling.
If anything, the historical precedent indicates that it takes quite a bit of time for recessions to emerge. A negative LEI frequently leads recessions by three quarters or more. The track record of inversions is even more variable. Every recession over the last 30 years started more than a year after the 10 year yield crossed below the 2 year. Utilizing the shape of the curve as a forecasting tool necessitates a period of more than a year and that is often too far away for Wall St.
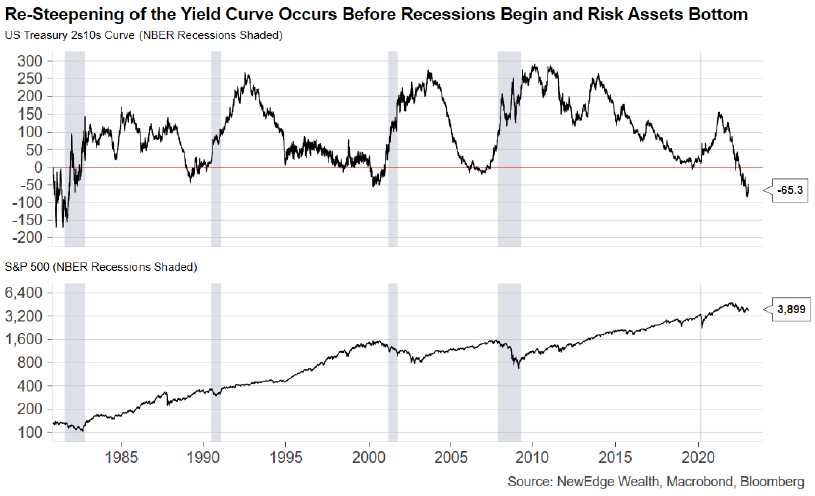
For those looking for something a bit more imminent they should pay less attention to when the curve inverts and more when it resteepens into positive territory. In each of the last 3 recessions (excluding the Black Swan of Covid) the 2s-10s curve moving back into positive territory coincides much more often with the start of a recession. Why? Because the short-end of the curve is realizing that a recession is at hand and that a rate cutting cycle is around the corner.
Figure 2: A De-Inversion of the Curve is a More Imminent Sign of Recession

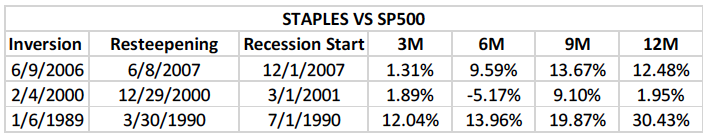
And for those who believe the stock market sniffs out recessions with reliability maybe a look at Figure 3 would be cause for examination. If, after seeing 2s-10s re-steepen, an investor put on an equal dollar amount shorting the S&P 500 and long the defensive Consumer Staples sector and held for a year they made pure alpha every single time.
Figure 3: A Long/Short trade of Staples/S&P500 After Resteepening Has Incredible Performance Record
2. The Soft Landing is Now
To advocate for the soft-landing endgame, one has to believe that the economic data from this point on in the U.S. will not get any worse, i.e. that the economy that we have today is the soft landing and the one in the future is no worse and most likely stronger. And believing that requires small probabilities being compounded over and over.
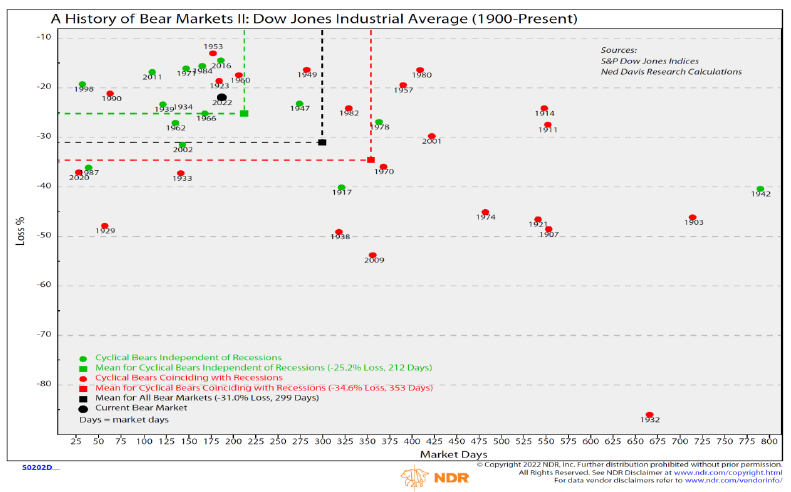
For one, the bear market seen over the last year would have been one of the most shallow and shortest in market history. Second, of the list of those bear markets that lasted for less time or were not as significant in magnitude even fewer occurred in the middle of a tightening cycle
Figure 4: A History of Bear Markets, Source: Ned Davis
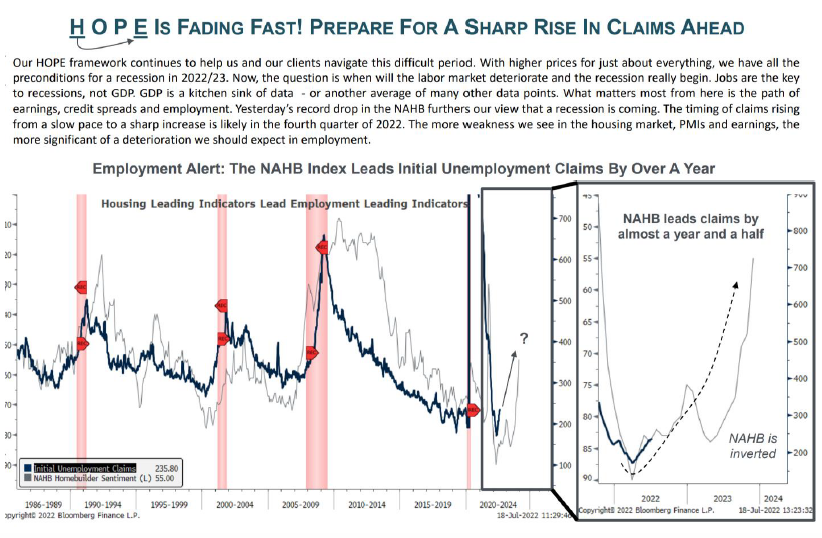
Third, as housing goes so goes the economy. And right now housing is going nowhere but down. Cancellation for home orders from the publicly traded housing companies is unprecedented and New Orders are collapsing as well. Given housing’s outsized roles in the economy and as a financial asset the historic pattern is one where turmoil within that sector does not stay contained (Figure 6). As credit conditions tighten, demand gets sapped from the rest of the economy, most prominent within the manufacturing sector and its reliance upon financing for new orders (Figure 7). Historically, an 18-month lead time of Fed Funds starts to show in Manufacturing New Orders. Given that most of the rate hikes occurred in the latter half of 2022 (and real yields only went positive over the same period of time) it is hard to think that one indicator after another will work in favor of stepping into risk now.
Figure 5: Housing Orders and Cancellations, Source: Bill McBride
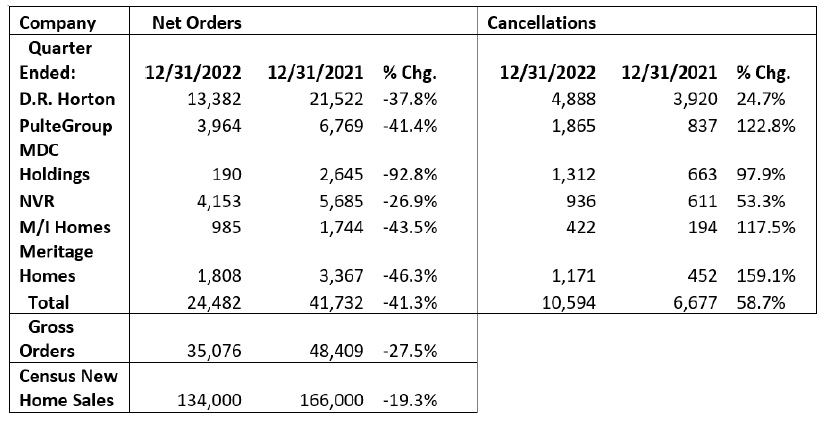
Figure 6: Housing Downturns Do Not Stay Contained, Source: Michael Kantrowitz

3. Having More than a Hammer
“If the only tool you have is a hammer, it is tempting to treat everything as if it were a nail” – Abraham Maslow
Like other professions, investors are wise to have as many instruments in their tool belts to assess prospective opportunities. A DCF doesn’t offer much help to a distressed company or a start up. There’s different ways to break down whether or not those opportunities offer value and they are skills in their own right.
The same applies for explaining macro market moves. The danger, of course, is the illusion of certainty and forsaking humility. While fundamentals win out in the long run, in between other frameworks such as investor money flows, policy pivot points, positioning can drive markets for extended periods of time. And there’s always the element of randomness as well. Understanding other toolsets can help one maintain clarity and look past noise and focus on the type of investments within their circle of competence.
So, in the midst of clearly deteriorating corporate fundamentals coming into focus this earnings season why has the market exuded such strength in 2023 and since the local bottom in October?
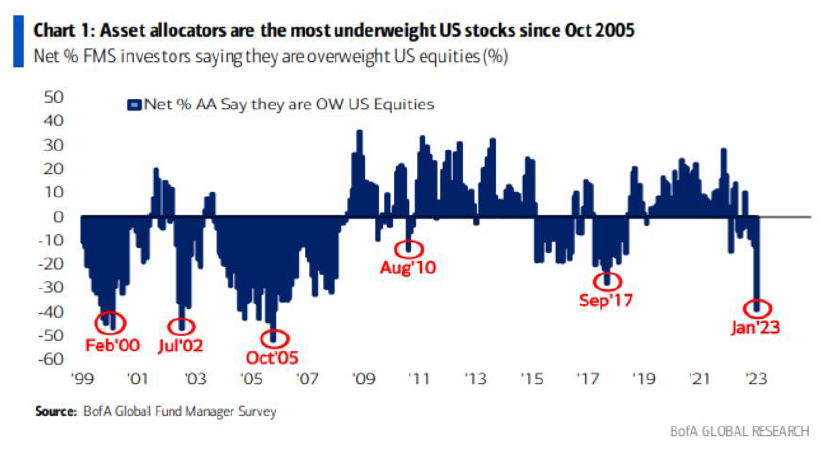
There’s a few options that could explain it. One, the belief of a soft landing being more and more possible, was already discussed and it has gained traction given the disinflation of the last few months and the weakness to come given the collapse of the housing market. Second, charts like Figure 4 have been frequently cited as advocating that the worst is priced in. Following the crowd doesn’t make money; its extreme positions are historically indicators of a strong counter move to come at least for some amount of time.
Figure 7: Asset Allocators Got Spooked in 2022, Source: Bank of America
One explanation that hasn’t been offered is a resurgence in liquidity in the back half of 2022. Press reports have mentioned financial conditions easing but the latter is often measured using equity prices and interest rates and thus it’s explanatory power is recursive; it’s akin to saying stocks have gone up because stocks aren’t going down.
One tool overlooked, and usually the first to be offered as an explanation, is improved market liquidity. It’s been overlooked because the Fed has embarked on the most drastic tightening cycle in a generation. But this overlooks other sources of liquidity and falsely equivocates all market liquidity as being beholden to the Fed. Investors’ willingness on their own can create liquidity with general risk appetite but that is difficult to measure. What is apparent in the data however is that throughout 2022 private sector demand for credit continued to run unabated and was far stronger than 2021 or the years immediately preceding the pandemic despite the tightening cycle.
Figure 8: Credit Creation Remained Exceptionally Strong in 2022, Source: Joseph Wang


Over $1.5 Trillion of credit was created from the private banking sector and credit unions in 2022, increasing the stock of financial assets flowing into the economy. This newly created money will run throughout the economy for quite some time and keep activity afloat. The exact effect will be unknown. It’s unlikely to be as effective as fiscal stimulus given that the latter bears interest and must one day be repaid overall but credit cycles can run for quite a while, regardless of what rates do. The mid-2000s taught us that.
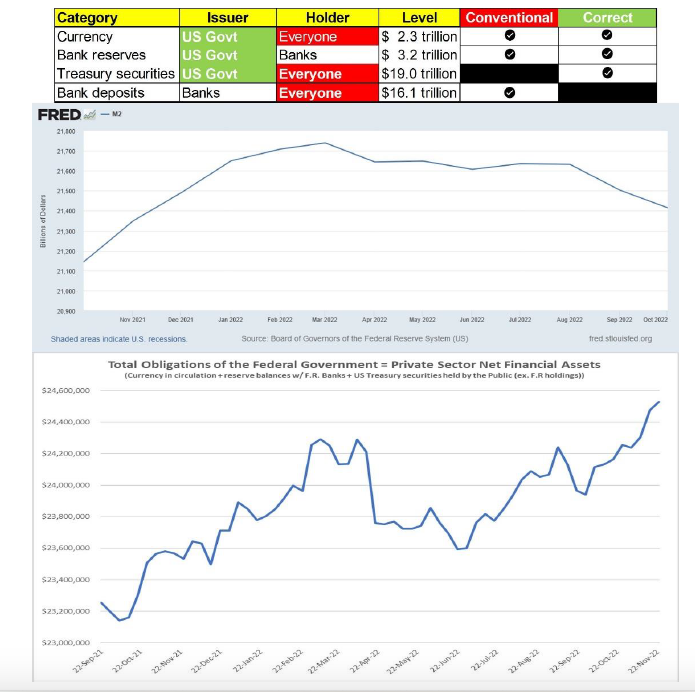
But even that overlooks the resumption of fiscal activity. 2022 lapped some of the largest increases in fiscal stimulus in economic history. Getting through that meant that the Treasury resuming issuance in the latter half of 2022 was increasing the stock of private financial assets. And if there’s anything that the Covid response should have taught people is that the impact of the fiscal purse dwarfs that of the Fed by orders of magnitude. The consistent exclusion of fiscal activity on liquidity and market plumbing is a disservice. That is why analyses focusing on conventional and outdated money stock measurements are shortsighted; there is a problem of misappropriating all liquidity as being sourced from monetary policy.
Figure 9: Conventional Measures of Money and Liquidity Overlook Fiscal Policy Impacts, Source: Bill
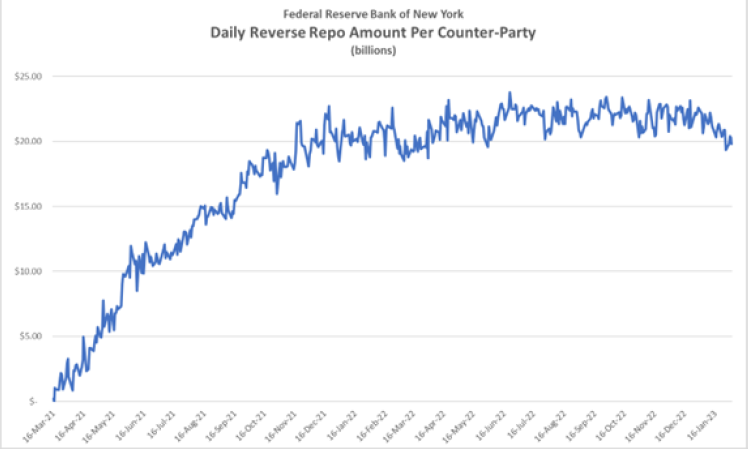
Further, despite rate increases in December (and now February) activity in the Overnight Reverse Repo Facility has stalled. This suggests marginal liquidity and dollars at work in the markets are not going to cash/short term destinations but rather to risk.
Figure 10: Overnight Reverse Repo Activity Has Stagnated

Liquidity, however, is not the end all be all driver of markets. It is important but so is many other things. It has explanatory power but so do animal spirits and there’s no way to quantify those reliably. So while the current rally may be induced by more money moving into the market at the end of the day if the fundamentals don’t support it then the real game being played is finding out who the Greater Fool is.
4. ChatGPT
The biggest story in technology and business in the last few months has been the meteoric rise in popularity and interest of chatGPT, the generative artificial intelligence service from OpenAI. The release of the service has sparked conversation, conjecture, and curiosity. Plenty of discussion surrounding the service has been on its effectiveness, consistency, structure, developmental future, financial backing, and ramifications on the micro and macro economy.
Figure 11: Google Searches for chatGPT Have Exploded

Interest in services like chatGPT specifically and Artificial Intelligence in general will ebb and flow over time. We are still very far off from some of the most lavish promises that A.I. was supposed to offer such as autonomous driving and we may not see genuine Artificial General Intelligence in this generation.
How people define and think of A.I. is rarely consistent from person to person and can encompass everything statistical techniques taught to every first year Econ major to the current transformer models with billions of parameters. Just how transformative and impactful A.I. is to be settled in the faraway future and beyond the scope of this piece. But it (should) be safe to say two things at the very least about what current and future A.I. services will offer society and the economy.
First, debates about what thresholds must be met for a service to constitute artificial general intelligence miss the mark in terms of impact. There is overwhelming evidence with current services that clearly show output that is incomprehensible, incorrect, and lacking the ability to reason and link conclusions on top of each other. While that may be the case, the “hurdle rate”, for lack of a better term, is less about whether A.I. services can think and reason along the level of the human brain and more about whether it is good enough for getting a particular job done. At the very least, these services may not be a revolution but they would be a further evolution of the software explosion the economy has seen over the last 15 years. And software is, ultimately, a tool to either reduce waste and downtime or create new frontiers of productivity.
Second, the best way to think about its impact on the macro economy both in the short term but also in the intermediate and very long term, is through the lens of comparative advantage. Like every technology revolution before it, if A.I. does end up having a transformative effect on the economy it will be through the transformation of the types of jobs done rather than the quantity of employment opportunities. It will push some workers into higher-value areas, where their opportunity cost for menial work is highest, and it will push other parts of the labor market into entirely new jobs and services that do not exist today. In either scenario, a Luddite dystopia is unlikely.