
As of yesterday’s close, the S&P 500 is up 19% in 2021 with the Nasdaq up just shy of 15% and the Russell 2000 up about 11.5%. This even though underneath the surface breadth has largely weakened since February (albeit there are pockets of improvement in the last couple of weeks). We’ve remarked previously that the healthiest markets are those that see the broadest participation in sectors, countries, and cap types (small, mid, large). The last few months wouldn’t fit that descriptor; instead, we’ve seen a divergence between the breadth and the price levels of some of the most important indices in the world.
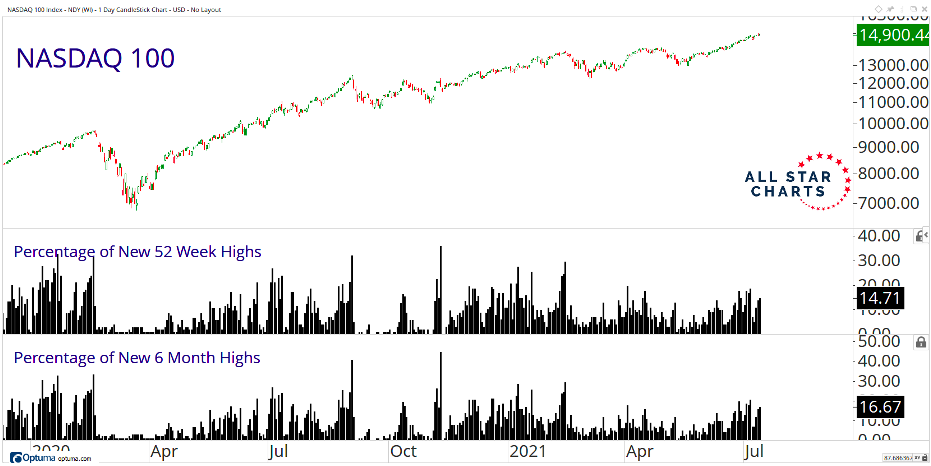
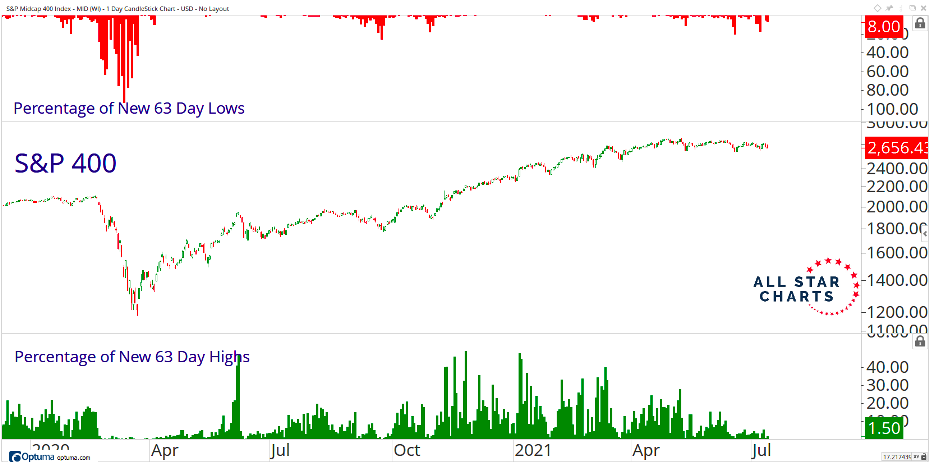
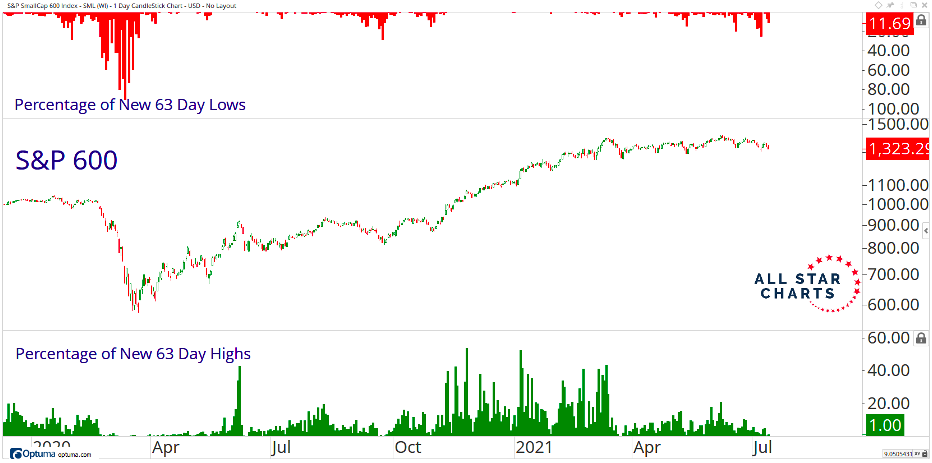
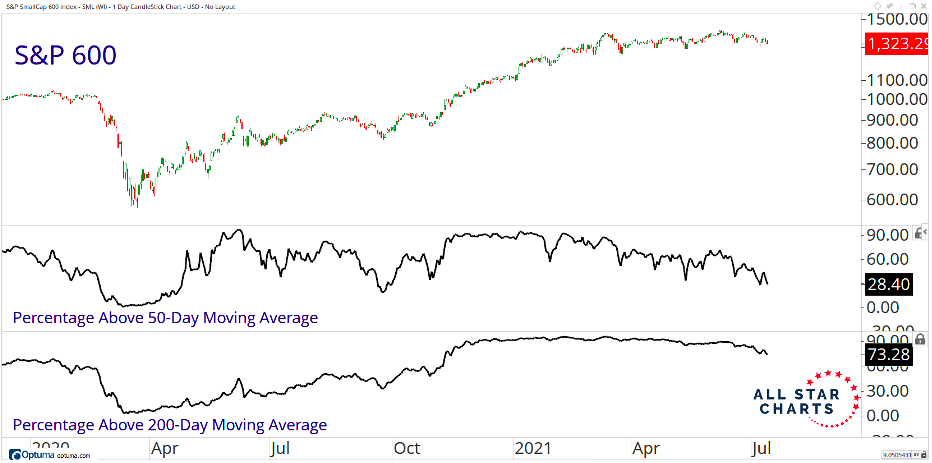
The Nasdaq is seeing far fewer companies make new yearly or 6 months highs. The MidCap 400 has seen 3 month lows collapse since the first quarter. The S&P Small Caps currently have less than 1/3 of firms above their 50 day average and a (small but) rising number of companies reaching 3 month lows. The Dow Transports experienced a 10% drawdown that seemed to go unnoticed.
Figure 1: Breadth Has Deteriorated in Recent Months, All Star Charts
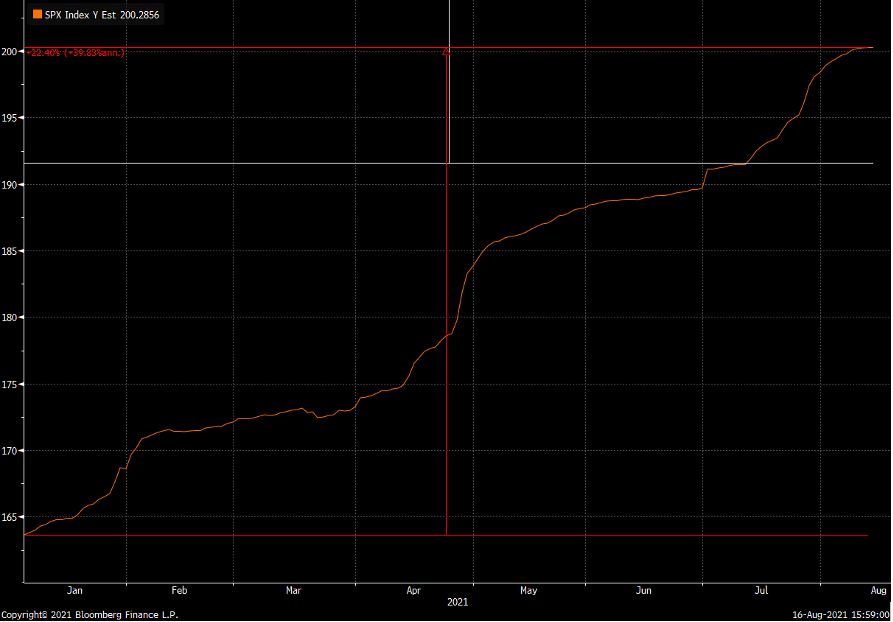
The average drawdown for a stock in the S&P 500 is 8%. For mid-caps it’s 13% and 18% for small-caps while the median Nasdaq stock is down 18% from its high. And yet the major averages continue to chug along and reach new highs or, in the case of small-caps, stay range-bound while digesting past gains. To go one step further, one could argue that the S&P 500, despite it’s 19% gain in price, is actually cheaper today than it was when we started the year (Figure 2). Earnings estimates for 2021 have increased by over 22% so far and with more potential to rise given the conservativeness displayed by management teams towards the second half of the year with the Delta variant creating uncertainty. Thus, multiples have actually contracted for this year (and more so next year) given that profitability is turning out to be much better than expected.
Figure 2: Earnings Estimates for 2021 are Up 22% This Year
This type of market activity reminds me of a phrase I once heard: There are two types of corrections. One is through price. The other is through time.
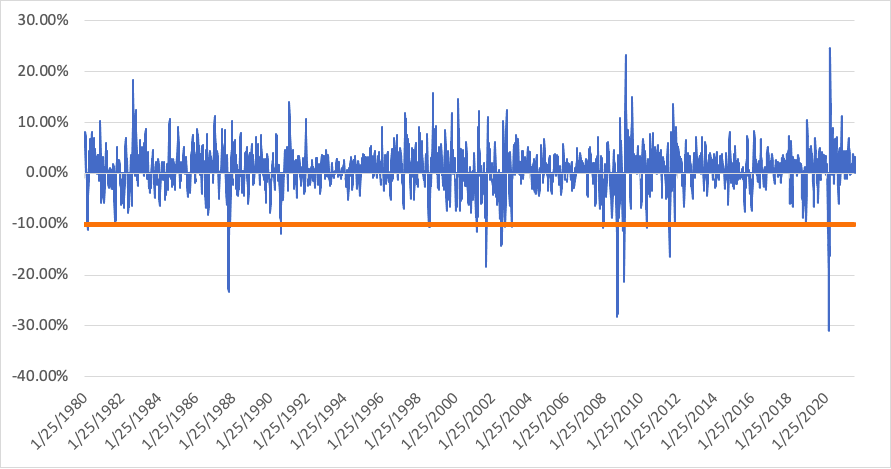
We’re all familiar with the former, defined, somewhat arbitrarily, as a 10% decline in stock prices. They’re fairly common occurrences with formal studies calculating that they occur roughly every 1.5 years and can be brought upon for any number of reasons (economic, geopolitical, technical, crowded positioning, etc).
Figure 3: S&P 500 Corrections
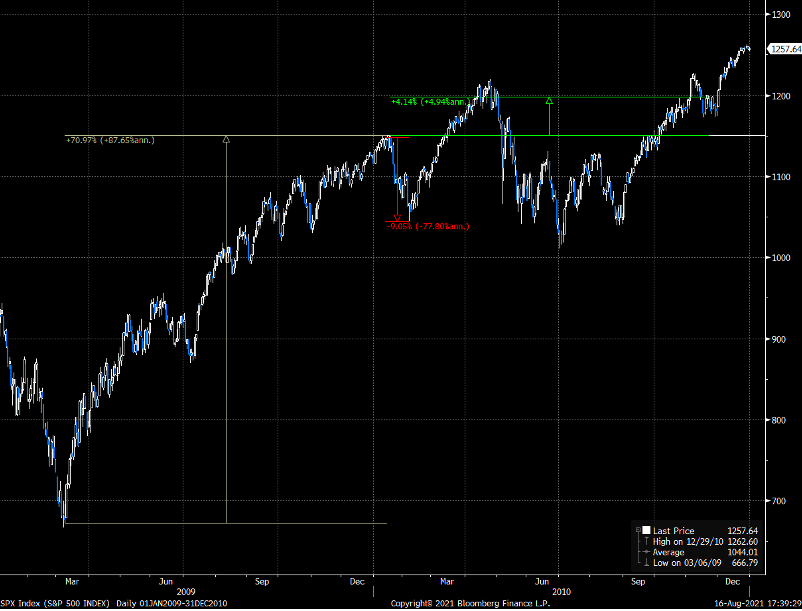
What is less frequently discussed is that markets can spend months and years within a range to nowhere. What’s even more interesting is how frequently they occur in the second year of an economic expansion and/or market rebound. Take the recovery after the Financial Crisis as an example. After gaining over 70% from the March 2009 bottoms the S&P 500 stayed in a tight 4% range from January through November. In between were sell-offs of 9% and 17% with a rally of 16% in between. And yet all in all the index ultimately went nowhere for nearly a year. EPS estimates grew 10% for 2010 and 15% for 2011 making stocks “cheaper” to own during that time period.
Figure 4: The Recovery From the Financial Crisis Stalled For Nearly a Year
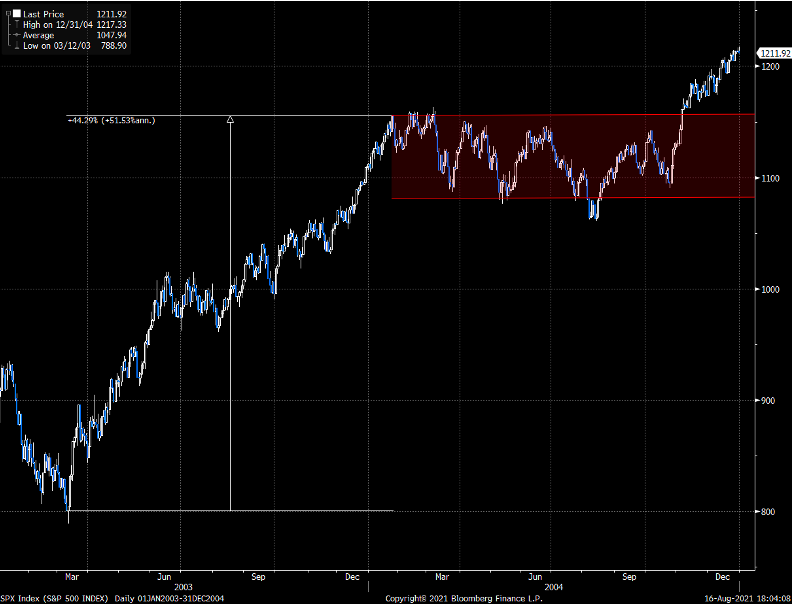
The same happened with the recovery from the Dot Com crash and the recession of 2001. A 45% boom off the bottom in 2003 gave way to a market that went nowhere for 11 months while earnings were revised up 17%.
While estimates for earnings are scant going back further the phenomenon of markets staying in a tight range during the second year of a recovery does have precedent. 1982 saw gains of nearly 70% before going nowhere for 13 months. The 1976 bull market also paused after gains of 70% and stayed flat for over 3 years. If there was ever evidence of the market as a discounting mechanism this would certainly fit the bill.
No, this isn’t to suggest there’s something magical about the second year of a bull market or that risk assets must resume higher from here eventually. Rather, history has given us plenty of examples of the market’s extraordinary ability to discount farther out than we give it credit for and that sometimes you can buy in at a higher price but at a superior value.
The only constant is the market’s ability to surprise and adapt.