During the month of July, economic momentum lost ground, as portrayed by the Consumer Sentiment Index shown below. Data related to employment, spending, and mobility also reflected the slow down.
Caution is also expressed regarding the next 2-3 months as the flu season will be upon us and the danger of a relapse in recession-like data might be emerging. After all, the latest data on economic activity is still negative, as shown below (interactive graph can be explored here).
Of course, in the meantime, global equities continue their rally and now the global capitalization of stocks has again surpassed the global GDP (see graph below), as it has done before in 2007 and 2017, when one looks at the historical record of the last 15 years.
As for the much-celebrated Chinese recovery, the following graphs tells the real story of a stalled Chinese economic recovery.
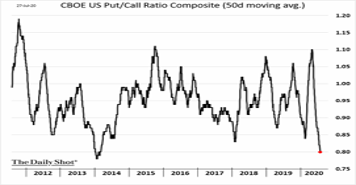
A growing complacency as reflected by the Put/Call Ratio (see image below) might be indicative of lofty valuations.
We understand the argument that strong growth rates and
solid margins may rationalize the phenomenal stock gains of the FANMAG
(Facebook, Amazon, Netflix, Microsoft, Apple, Google), even if we still have reservations.
However, that doesn’t justify the fact that about 500 stocks (out of the 2000 stocks
included in the Russell 2000) trade at multiples that far exceed those of the
FANMAG.
We are in the middle of August, and we hope that the guns of
August will remain silent, however as we contemplate the above while re-reading
sections of Euripides’ Medea tragedy, we are thinking that the world order and
the global balance of power always redresses issues of inequity and hubris of
those who despise freedom while aspiring to power and gains using questionable
means.
Reviewing Economic Developments: Getting Away from Colchis with the Golden Fleece
Author : John E. Charalambakis
Date : August 11, 2020
During the month of July, economic momentum lost ground, as portrayed by the Consumer Sentiment Index shown below. Data related to employment, spending, and mobility also reflected the slow down.
Caution is also expressed regarding the next 2-3 months as the flu season will be upon us and the danger of a relapse in recession-like data might be emerging. After all, the latest data on economic activity is still negative, as shown below (interactive graph can be explored here).
Of course, in the meantime, global equities continue their rally and now the global capitalization of stocks has again surpassed the global GDP (see graph below), as it has done before in 2007 and 2017, when one looks at the historical record of the last 15 years.
As for the much-celebrated Chinese recovery, the following graphs tells the real story of a stalled Chinese economic recovery.
A growing complacency as reflected by the Put/Call Ratio (see image below) might be indicative of lofty valuations.
We understand the argument that strong growth rates and solid margins may rationalize the phenomenal stock gains of the FANMAG (Facebook, Amazon, Netflix, Microsoft, Apple, Google), even if we still have reservations. However, that doesn’t justify the fact that about 500 stocks (out of the 2000 stocks included in the Russell 2000) trade at multiples that far exceed those of the FANMAG.
We are in the middle of August, and we hope that the guns of August will remain silent, however as we contemplate the above while re-reading sections of Euripides’ Medea tragedy, we are thinking that the world order and the global balance of power always redresses issues of inequity and hubris of those who despise freedom while aspiring to power and gains using questionable means.