“All of humanity’s problems stem from man’s inability to sit quietly in a
Pascal
room alone.”
I used the quote from Pascal above to close out a piece a couple of
months ago. In it, I lamented that investors seem obsessed with always
finding monocausal explanations for what goes on in the market. Just
about every day that you check CNBC’s website at the market close
you’ll see a summary of performance with a handful of words connecting some macroeconomic event directly to how stocks performed. Having the patience to let events unfold, think extra critically, or say I don’t know maybe in an even greater shortage than chips, workers, or a host of other items.
The area of focus at the time, and this piece, is what explains the weak performance of a slew of “growth” stocks. After an explosive 2020 companies that were billed up as promising disruption across industries such as drug discovery, health insurance, cars, and computing were badly underperforming the rest of the market, although still up quite nicely
compared to pre-COVID times. I mentioned that even though that some names like Tesla, Roku, Fastly, and many more had seen their equity value collapse by 20%, 30% or more in the span of two weeks there was plenty more room to go. Well, over the last couple of weeks these names took another hit, though not quite as severe in most cases as their declines in February.
The rationale then and now are essentially the same: higher interest rates. In February, the 10-year yield rose from around 1.15% to around 1.6% during this rough time for some of these “growth” names. Their “value” counterparts held up much better, even rising during this time (Figure 1).
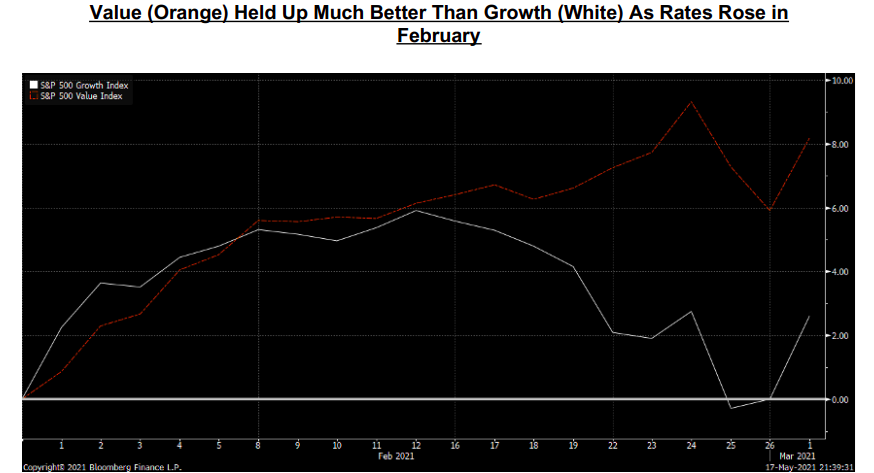
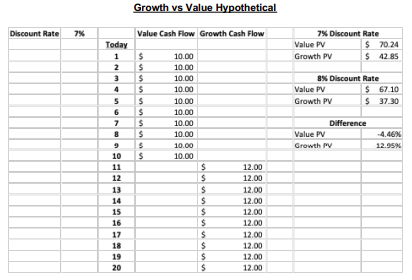
To anyone who has taken some semblance of a finance course this made sense. “Growth” names were investing much more in the present to capture some opportunity and wouldn’t generate the majority of their free cash flow until later. Because their cash flow was further out into the future than a value stock, the math behind discounting meant that those future cash flows would be disproportionally impacted by a rise in interest rates. A basic example demonstrating the principle is below. The only difference in the below example is when the cash flows appear; for growth stocks that promise lower cash flow today in exchange for greater cash flow later on an identical rise in the discount rate has a greater impact on present value.
The sell-off during the last couple of weeks culminated with the CPI report showing a 0.8% month over month increase in the general price level and a 4.2% increase over last year, the highest annual increase since June 2008. To most, higher inflation necessitates a rise in risk-free rates to compensate net savers. Thus, another decline made perfect sense to those in the camp that “growth” stocks were a long-duration play. Since technology stocks are most associated with growth, they should underperform.
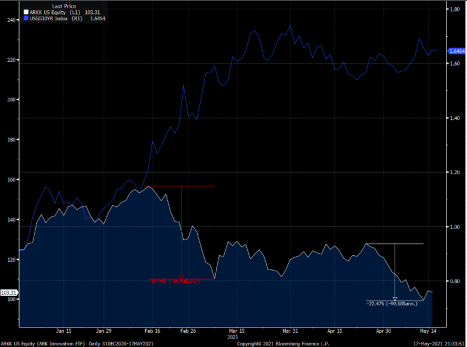
But a funny thing happened that hardly anyone I’ve seen mention: rates haven’t budged. The “growth” stocks sold off anyways, underperforming “value” names by 6% in about two weeks. The most damage was reserved for those speculative names who had the rosiest of fortunes priced in (Figure 2).
Growth Stocks Underperformed But “Disruption” (White) Got Decimated…Even Though Rates (Blue) Went Nowhere
Of course, no one bothered to ask if the whole narrative around “growth” and interest rate dependence was spurious or not (it is). I don’t expect anyone to revise their preconceived notions about the relationship between anytime soon either. Old ideas and heuristics don’t go away that easily.
A devil’s advocate may say that it was a one-time incident, or that the underperformance was discounted in rates back in February but not in equity markets until more recently. It’s an understandable point but one that doesn’t hold weight when held up to some scrutiny (thanks to insights by an analyst I greatly admire, Jesse Livermore).
Take an example below of a “Value” stock and a “Growth” stock. The Value stock has $1 in current EPS. It reinvests all earnings into an 8% ROI for 20 years. After that, all earnings get paid out to shareholders. Here’s what the earnings and payout to investors look like over 30 years. The Growth stock has $1 in current EPS as well and reinvests all earnings for a 30% ROI over those same 20 years before distributing all earnings out as dividends.
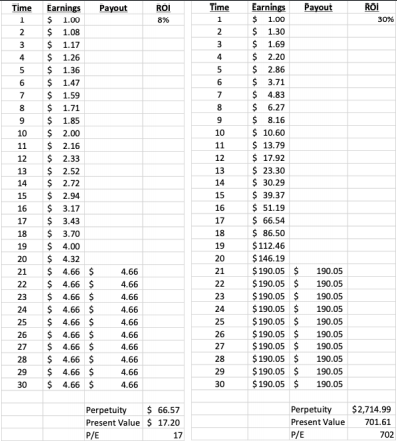
The “Value” stock at a 7% discount rate trades at a P/E ratio of 17 after discounting those future dividends to the present. The “Growth” stock at a 7% discount rate trades at a P/E ratio of 702, much higher given the tremendous growth potential offered by the business.
Now, let’s increase the discount rate to 8% for both stocks.
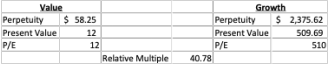
The “Value” Stock now trades at a P/E of 12 while the “Growth” stock trades at a P/E of 510. You might think that represents a much greater compression in valuation. You’d only be partially right. Which is why I include the Relative Multiple calculation: 510, the multiple of the growth stock, divided by 12, the multiple of the value stock. The ratio of valuations is 40.78.
Under the scenario of lower rates previously, the ratio of valuations is exactly the same:
40.78 (702 / 17). The effect of higher interest rates for a growth stock and a value stock were exactly proportional. Growth stocks don’t live in a different economy from value stocks. There’s no separate interest rate for the two of them. The relationship between rates and some statistical classification of securities is completely spurious. Classifying stocks in this way says nothing about their current ability to pay out or consume cash.
So why have these classifications performed the way they have over the last couple of months? I wouldn’t be quick to express a certainty but if I had to it’s because the marginal improvement in the real economy is coming from areas like Energy, Materials, Financials and Industrials like we predicted months ago. The market couldn’t care less about how some investors group stocks.
But don’t expect the narrative to go away anytime soon.