
Over 200 years after the fall of Genghis Khan his empire was in tatters, split up among warring factions divided by tribalism and nominally ruled by outsiders in China and the Middle East. The title of “Khan” was still sought after for the status and privilege it conveyed but it signified no exceptional power. As such, after the sitting Khan passed away in 1470 several suitors pursued a union with Queen Manduhai in order to attain the title and an edge against competing factions.
Instead, Manduhai pursued her own plan of uniting the disparate nation. She found and wed the last remaining male descendant of Genghis Khan, a sickly 7 year-old boy, making him Khan and herself Queen. Over the ensuing years she utilized every tool available in her arsenal to consolidate power and leadership. She utilized soft power by publicly engaging in spiritual rituals and prayers to garner credibility from tribes and people to whom that mattered the most. She struck alliances with rivals to the east, avoiding a costly fight and securing one front. She was influential in winning battles to the west, displaying courage and intelligence. Finally, in the aftermath of battle, she was restrained from expanding her victories, knowing it would just create and provoke new enemies. She had accomplished what she set out to do. She wasn’t a “hammer that only sees nails,” but instead knew when it was time to be aggressive, where limits existed, when to attack, and when enough was done. It’s why she’s now remembered as Manduhai the Wise.
Her example is a lesson in the distinction between necessary but insufficient conditions; royal status wasn’t sufficient of power and influence. Neither was having the last remaining descendant of Genghis Khan by her side.
As an example, being male is a necessary condition for being a brother. It is not a sufficient condition of course. The logic of necessary but insufficient conditions is a concept that is tested as early as the high-school level for students taking standardized tests. Despite such early exposure it doesn’t seem to stick. At least that’s my conclusion the more and more I encounter both people and publications remarking on the current state of monetary and economic affairs.
Take the volatility in the repo markets roughly a year ago (Figure 1).
Figure 1: Overnight Repo Rates
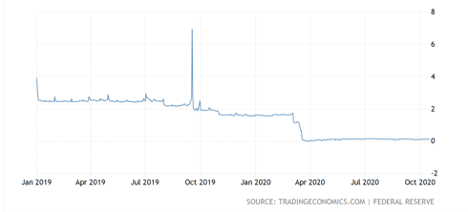
Overnight borrowing rates for some of the globe’s largest financial institutions jumped to their highest levels since the Financial Crisis last September. It was a perfect storm of events. For one, the Fed’s balance sheet had been decreasing, removing reserves out of the financial system. Second, Basel 3 implemented two key liquidity metrics that banks must meet. The first, the Liquidity Coverage Ratio, requires banks to hold enough liquid assets, such as US Treasuries, to meet future outgoing cash needs. On this, the banks scored fine. The second measure, Resolution Liquidity, applied to systemically important banks and requires these institutions to meet all liquidity needs without borrowing in short-term markets, including repo. This incentivized the hoarding of liquidity to make sure banks passed on this metric. Simultaneously, deadlines for corporate tax payments within this time period drained cash from the system and left banks without enough reserves. As a result, the Fed stepped in with more reserves so that the market would calm down and operate normally, something it did every day for years prior to the Financial Crisis (Figure 2).
Figure 2: Repo Interventions Prior to the Crisis
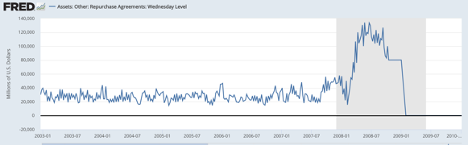
But to many the program qualified as a new round of Quantitative Easing. They ignored its temporary nature, the composition of bonds being considered, the context of the system’s financial plumbing and the fact that the Fed’s actions were standard operating procedure back when policy was considered in a “normal” state. All they saw was that the Fed was replacing bonds with reserves. Nothing else mattered.
But if that’s all it takes, then why isn’t the Fed’s Open Market Operations considered QE? After all, to implement monetary policy the Fed buys (or sells) bonds. Should we consider the entire history of monetary policy as QE? If so, then we’re not on QE 3 or 4 but closer to 400. Buying bonds is a necessary, but not sufficient condition for policy to be considered QE.
A more recent example is the hysteria over debt monetization as Congress debates and negotiates an additional stimulus package in light of the COVID-19 pandemic. The belief being that because the government is expanding the size of its deficits (it hit a record $3 trillion in Fiscal 2020) and the Fed is buying bonds/engaging in QE that the US government is reliant upon the Fed for financing.
Stepping back, debt monetization is the means by which borrowers are bailed out without formally defaulting on the lender. Notable historical examples include Germany during the Weimar Republic and Zimbabwe in more modern times. An inability to finance its own spending via tax receipts and an inability to borrow from capital markets drives functionally insolvent governments to print IOUs and have them be purchased by their own central bank indefinitely. It’s a situation whereby the government has no other hope of financing other than via its central bank.
The presence of expansionary monetary policy and widening deficits are necessary but not sufficient conditions for debt monetization. If they were sufficient, then you would have to conclude that the US was monetizing its debt during every recession including the recessions of the early 90s, or the early 2000s, or in the aftermath of the Financial Crisis. Why? Because automatic stabilizers, such as unemployment insurance or Medicaid, increase the deficit while the Fed buys bonds to lower interest rates in an attempt to stimulate. Yet no one argues that this is the case.
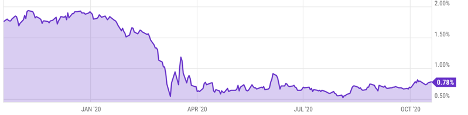
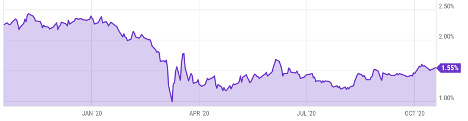
The US is nowhere close to such a situation. For one, prior to the pandemic the US had a deficit of $1 trillion and rates were nowhere near prohibitive levels. The 10-year rate was below 2% and 30-year rates were below 2.5% and the Fed was not engaged in QE during this period. Yes, deficits are currently higher but in order to believe that the current situation amounts to debt monetization one must believe deficits will permanently (beyond the time that COVID is with us) be multiples of historical levels and that no one would be willing to purchase US bonds to finance the spending. Considering that investors have scooped up low rate debt for years in Japan and negative rate debt in Europe prior to COVID-19 call me skeptical that there wouldn’t be demand for US debt when it’s supported by an economy that actually can and will grow in the future. Would rates be higher without the Fed’s actions? Sure. Would they be so much higher that the economy couldn’t grow? Highly doubtful.
Figure 3: US 10-Year Rates and 30-Year Rates
I’m not sure why people resort to such shortcuts in their thinking. My guess is people take the easy way out and prefer to resort to prejudiced opinions and easy to construct narratives than actually trying to figure out what is going on. Or they just like to always have someone to blame for something. Maybe there’s another explanation. But the phenomenon is widespread, from investors, to Wall Street strategists, to even people like the Bond King Bill Gross. If no one was willing to finance what remains the most innovative and robust economy in the world you would see it in some dramatic way in a market somewhere.
In continuing to look for reasons in which I underestimated the ability of the market to recover from the sell-off this spring I asked myself if there was sufficient growth looking out several years to justify the market at current prices. Specifically, if looking at current valuation levels is necessary but probably not sufficient for gauging the prospects offered by asset markets maybe adding growth to the picture can shed some light. While the absolute valuation levels do indeed look high, including to me, after reflecting on my post from April, where I looked at what past economic recoveries looked like, maybe historical growth patterns justified the market.
First, in the last 30 years there have been 4 instances of earnings contractions for the S&P 500, three of which occurred during economic recessions (Figure 4).
Figure 4: Past Earnings Contractions
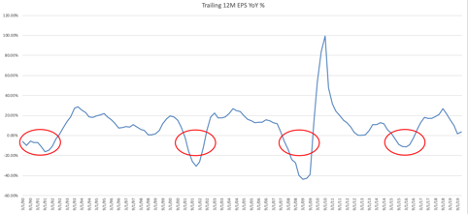

Coming out of these recessions EPS growth has averaged ~17% per year. Mid double-digit EPS growth was consistent during these periods. EPS growth of 17% from 2020 on results in future earnings that look like Figure 5, assuming 2020 comes in around $120 per share, roughly where current estimates are for the year, and a discount rate of 10%.
Figure 5: Future EPS and Current Multiples
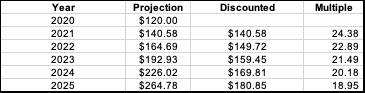
Even after considering future growth, current prices are rich in terms of earnings multiples. Perhaps the second derivative matters more? Specifically, maybe longer periods of accelerating growth create a path for average growth to take over and lead to an overall higher peak. Using the same data, I divided up each recovery period into periods of accelerating growth and decelerating growth. Across the four historical periods the average growth rate during accelerating phases was roughly 22% per year and 10% in the decelerating years. Based on the historical average of 13 accelerating periods and 10 decelerating periods the future outlook looks like Figure 6.
Figure 6: Future EPS and Current Multiples, Segmented Growth Phases
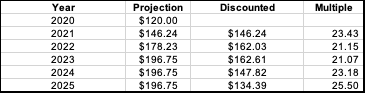
Valuations look better, but only marginally and are still very expensive relative to the 16x-17x we’ve seen over long-term history.
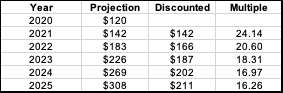
The final test was to try and get even more granular. Specifically, going year by year from each historical example take the best growth rate for each 12-month period.
Figure 7: Best Case Scenario

Using the best growth rate for each 12-month period (except for the Financial Crisis given how depressed earnings were) finally yields some multiples that look reasonable, albeit on a very long-term basis.
Perhaps the fact that the most optimistic (and least likely) of scenarios was the only one to bring about a reasonable outlook on valuations should say everything we need to know about where markets are currently trading. It’s no surprise then that the best model I know of for projecting future returns also leaves little room for optimism.
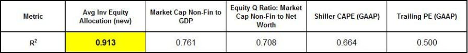
Figure 8: Household Equity Allocation and Forward Returns (Philosophical Economics)
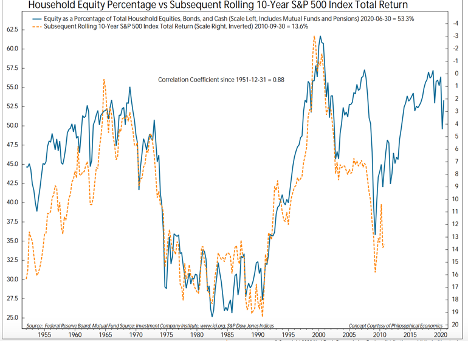
As a result, I still think it’s safe to say that the value offered by the market at present is both insufficient and reasons for optimism are not necessary.