
By Joel N. Charalambakis
“In the long term, it’s hard for a stock to earn a much better return than the business which underlies it earns. If the business earns six percent on capital over forty years and you hold it for that forty years, you’re not going to make much different than a six percent return-even if you originally buy it at a huge discount. Conversely, if a business earns eighteen percent on capital over twenty or thirty years, even if you pay an expensive looking price, you’ll end up with one hell of a result.”
Charlie Munger
A wide array of criteria are evaluated whenever an investor searches out or reviews an investment manager to invest his/her capital. Familiarity, reputation, fees, other services provided, etc. Yet inevitably the review zeroes in on the consistent ability to generate returns consistent with one’s financial goals. It’s a simple premise: I have X to invest which has grown to an amount Y, generating a return of Z.
Why shouldn’t the same ritual apply to evaluating investments in individual names? Much is often made about PE ratios, analyst projections, or even macro factors yet there is a dearth of analysis centering on whether or not the economics of a business are favorable or not. If deploying savings into investments with the expectation of a certain return is at the heart of a long-term financial plan then it follows to reason that said funds deployed should be biased towards businesses that themselves possess favorable economics.
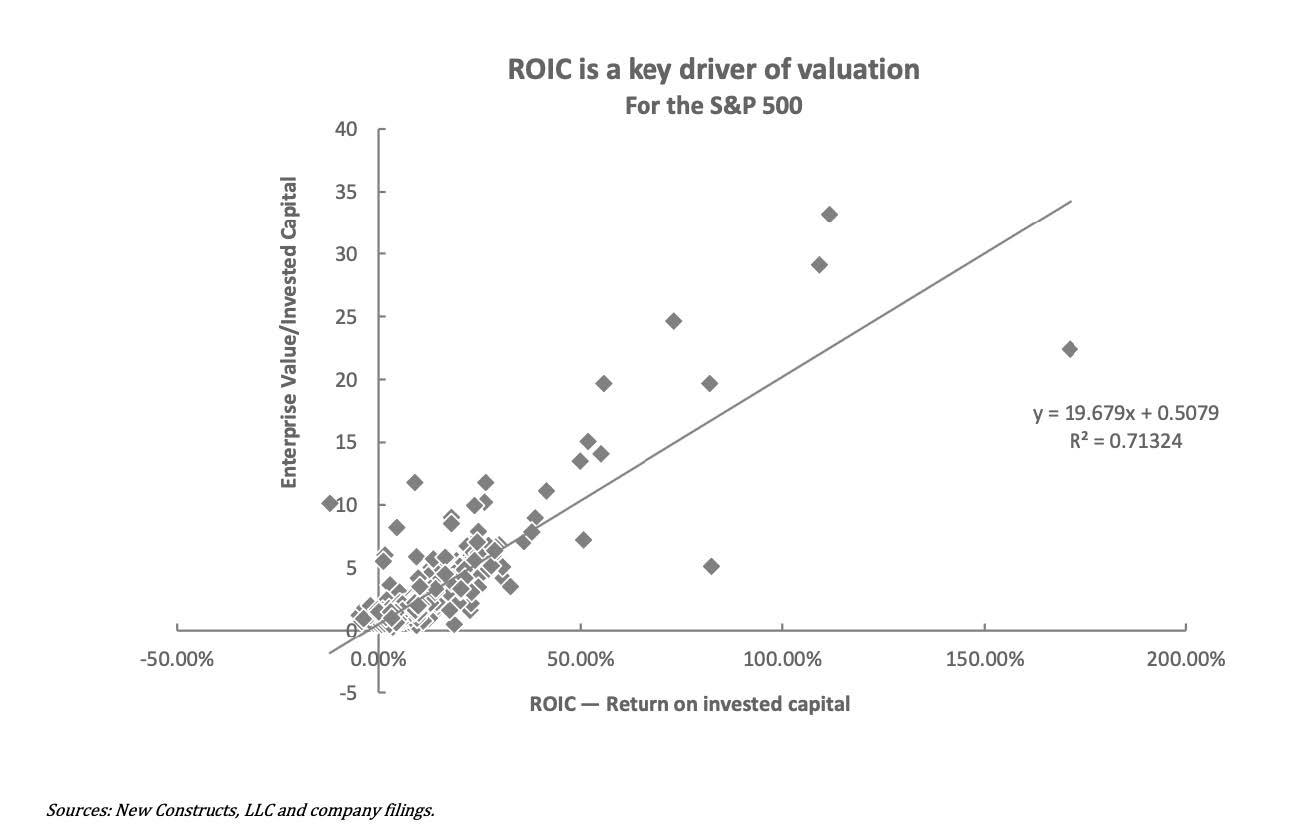
It’s an imperfect analogy but Return on Invested Capital (ROIC) as a metric of business quality functions similarly to measuring portfolio returns as mentioned in the opening paragraph: what does a business earn on the cash invested in its operations? Companies that produce extraordinary returns on invested capital generate more cash that can be returned to shareholders, used for M&A, or reinvested back into their business. Historically, the median firm in the S&P 500 earns an ROIC of around 10% over the long-run, roughly in line with the cost of capital. No wonder then the strong relationship between ROIC and valuation (Figure 1).
Figure 1: ROIC and Valuation (Source: New Constructs)
Any company that can produce such outsized returns, however, will inevitably attract competition and drive down returns (Figure 2).
Figure 2: ROIC Decay (Source: Valuation by McKinsey)
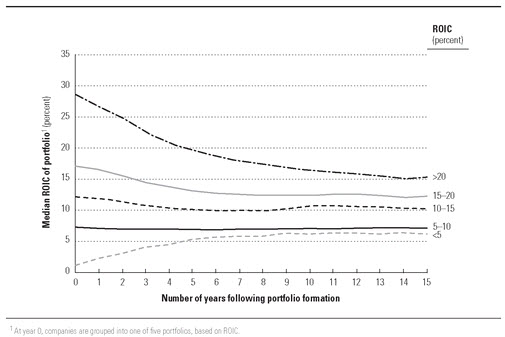
Notice however the top two quintiles of companies in the chart above, studied by McKinsey. While they do experience some decay, the returns generated by these businesses maintain their above-average levels, justifying higher valuations and superior long-term returns.
So then, what explains such large variances in ROIC? In short, these companies have a moat. They have some sort of unique set of characteristics cannot be easily imitated by competitors without the latter devastating its current economics. These advantages can range from a differentiated business model, unique intellectual property, exclusive access to certain resources, and more. As a result of their competitive advantage, they can sustain large deviations in ROIC and produce outsized returns.
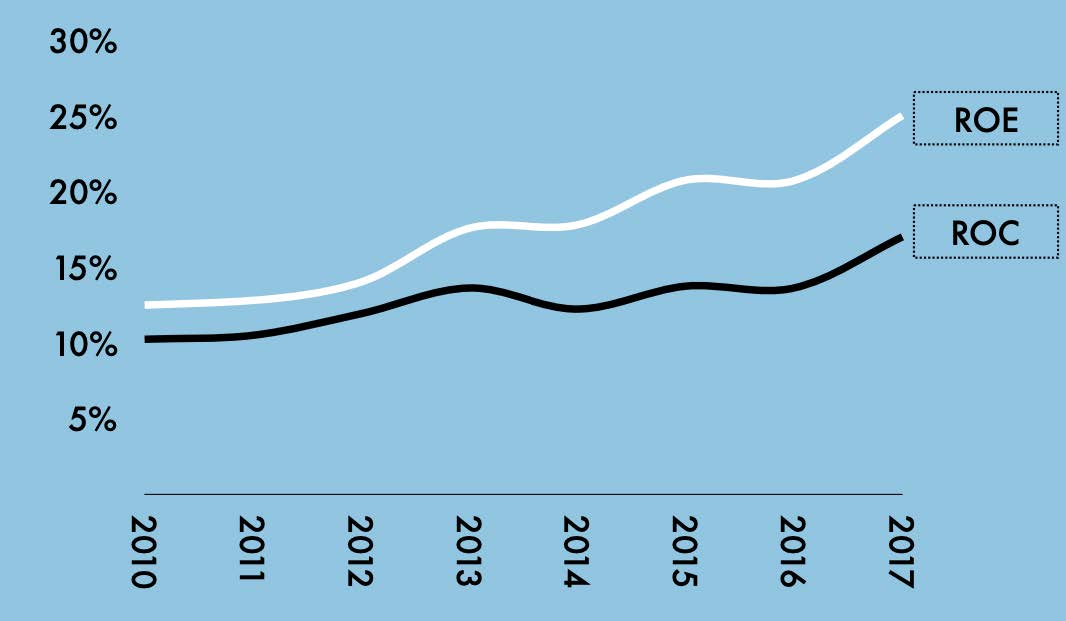
Take two companies often grouped together in an extremely competitive field: Kroger and Costco. On the surface, these companies are similar in that a consumer can buy virtually the same items at either retailer: groceries, household products, alcohol, gas, and access services such as a pharmacy. Yet the economics between the two could not be more different. Whereas Kroger, the largest pure grocer in the country, produces an ROIC, on average, of around 8%, Costco’s returns are much higher, around 17% and rising.
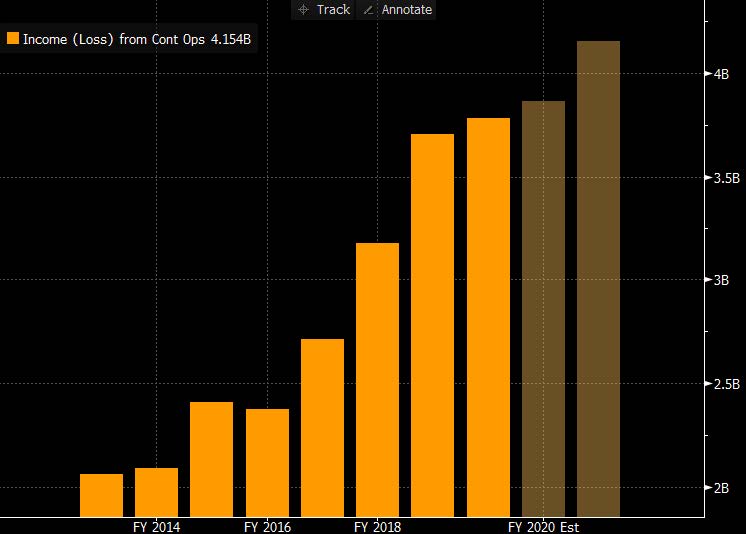
Figure 3: Costco’s Returns on Invested Capital (Source: MineSafetyDisclosure)
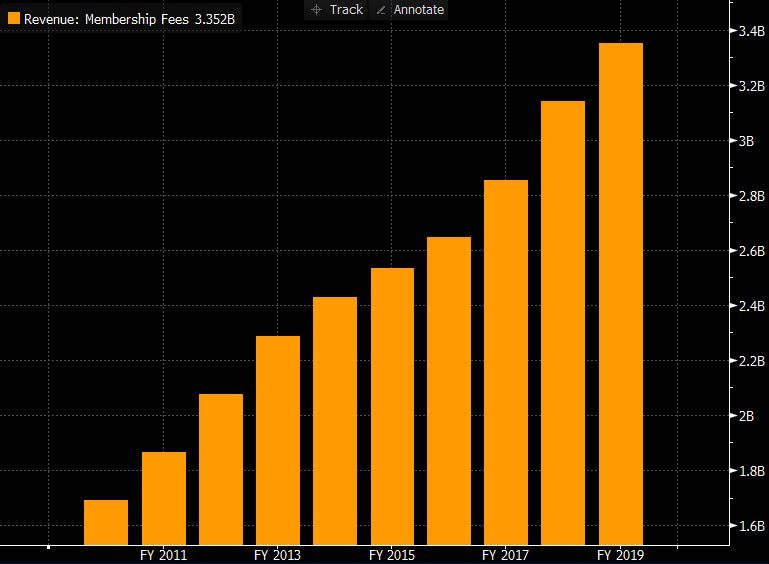
How can two companies, in the simple field of grocery retail, selling the same goods produce such drastically different results? The answer lies in their vastly different business models. While Kroger is reliant upon buying goods from manufacturers and reselling them to consumers for profit, Costco makes almost nothing from the goods it sells. Instead, Costco functions as the lowcost leader in an extremely competitive industry known for already razor-thin margins. To access such prices however, a consumer must pay a membership fee to access the store. Figure 4 demonstrates that essentially, all of Costco’s pre-tax profits come from their membership fees; in their last fiscal year the company made $3.3 billion in revenue from membership fees, but since they cost nothing to generate these revenues go straight to the bottom line. In total, the company generated pre-tax profit of $4.2 billion. With total sales of $151 billion last year (excluding fees), just $900 million is counted as profit for Costco, a margin of roughly half of 1%.
Figure 4: Costco as Low Cost Leader
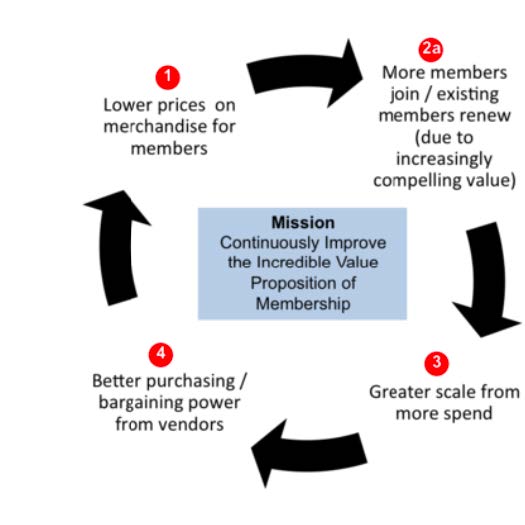
By relying upon the membership fee for profit, Costco never needs to worry about making money on groceries or other items. Instead, it is able to undercut all competitors on price. Low prices drive more members. More members provide greater scale, over which to spread overhead. Greater scale provides greater purchasing power from suppliers. But with those reduced prices, Costco passes them on to the consumer rather than reaping them itself, starting the flywheel all over again.
Figure 5: The Costco Model (Source: Scuttlebutt)
While the model may appear simple, mimicking it is extremely difficult due to all of the secondary choices Costco must be committed to in order to be successful. Costco only stocks around 4,000 SKUs in its stores while Walmart will stock over 100,000 and Kroger over 50,000. Limited selection translates to greater purchase quantities which leads to lower prices, reinforcing the advantage. Within those 4,000 SKUs you will only find high-quality items, instead of the range of high to low quality items found in traditional retail environments; Costco stocks items that the company’s internal team of merchants and purchasing managers knows will sell. Otherwise, space is wasted and items get returned, increasing costs, the exact opposite of the model. Costco also pays wages to its employees far above the competition. Why? To reduce labor turnover. Whereas the average retailer has employee turnover of 59%, Costco’s is just 5%. The result is a more efficient workforce, especially given the lower SKU count. A more productive workforce results in greater asset utilization and inventory turnover, resulting in rising returns over a fixed asset base.
There are countless other examples of what may look like features or perks of Costco but what they represent is a deliberate choice and commitment, one that is total in nature as opposed to selective. As a result of all these choices, Costco deepens its moats and cements its model.
The results, over the long-term, speak for themselves.
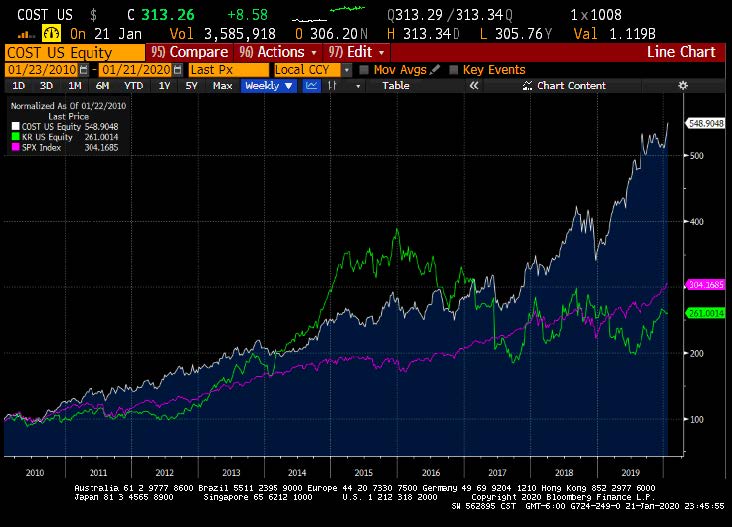
Any narrative can grip markets for a year or two, but the further one looks out, the greater the likelihood that business and economic fundamentals assume their logical order. Notice the two year stretch where Kroger outperformed both Costco and the broader market thanks to its foray into organic products, private label expansion and grocery inflation. Such trends were not sustainable forever. The former (organics and private label) is easily imitated and has been by competitors such as Wal-Mart. The latter, grocery inflation, is out of one’s control and works as a rising tide for all boats. Eventually, the tide washed Kroger out.
There’s more than one way to make money in the markets. Any good investor would be wise to possess as many tools in his toolkit as possible that can produce returns. At the core, however, we would argue that understanding the importance of ROIC and the drivers of it for each individual investment would reign paramount, especially for those looking to avoid being at the mercy of randomness that dominates in the short-term.