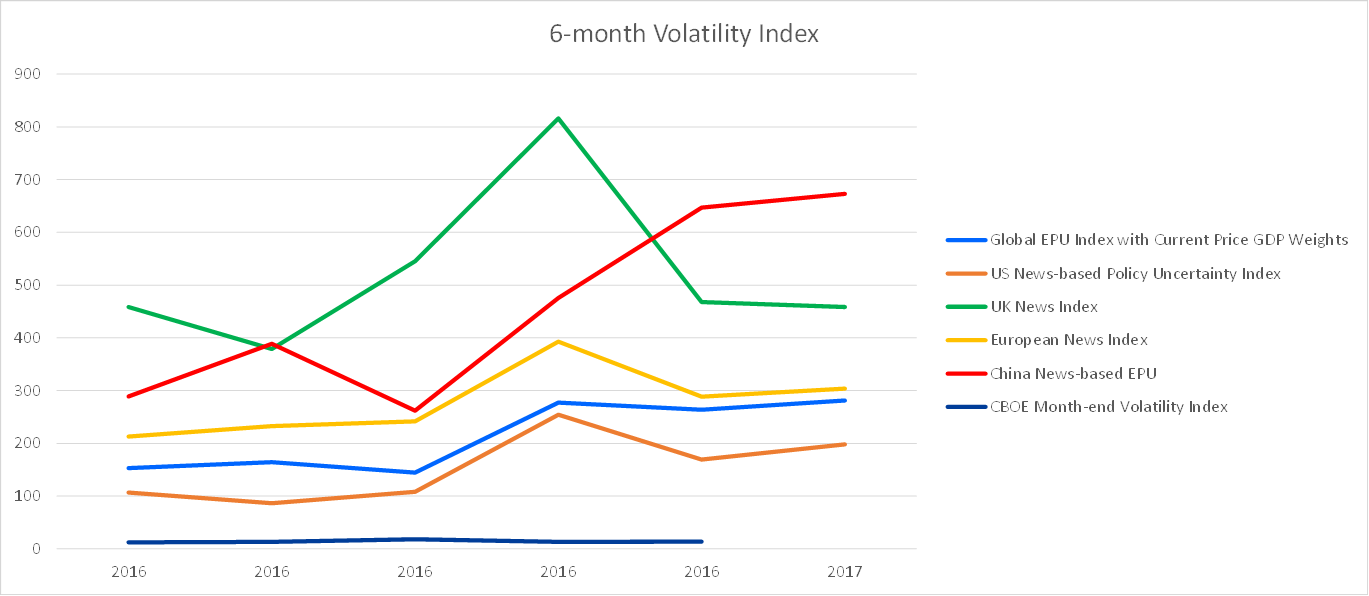
In last week’s commentary we wrote that the earnings, production, and income pictures look good and that the market has legs to make further earnings. The market continued in its upswing mode ignoring the above-average high multiples, but also the rising uncertainty around the world. The first graph below signifies the uncertainty index and its constant increase over the course of the last six months for different regions around the world.
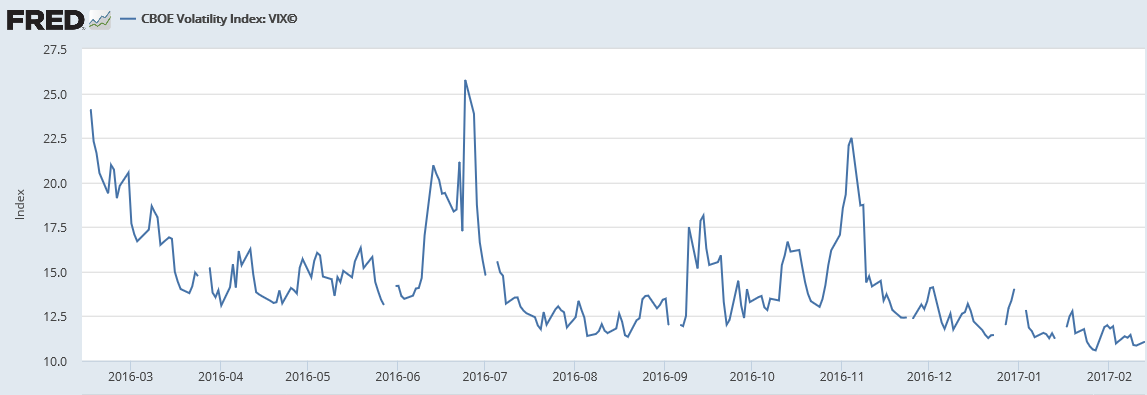
Under normal circumstance a rising level of uncertainty regarding economic fundamentals, as well as policy design and execution should be accompanied by a rising level of market volatility. However, as the second graph below shows, the volatility index continues dropping signifying a confident market that can (rightly) ignore noise. The problem is that the markets seem to ignore also the risk of not knowing where policy is going and how it is being planned and executed.
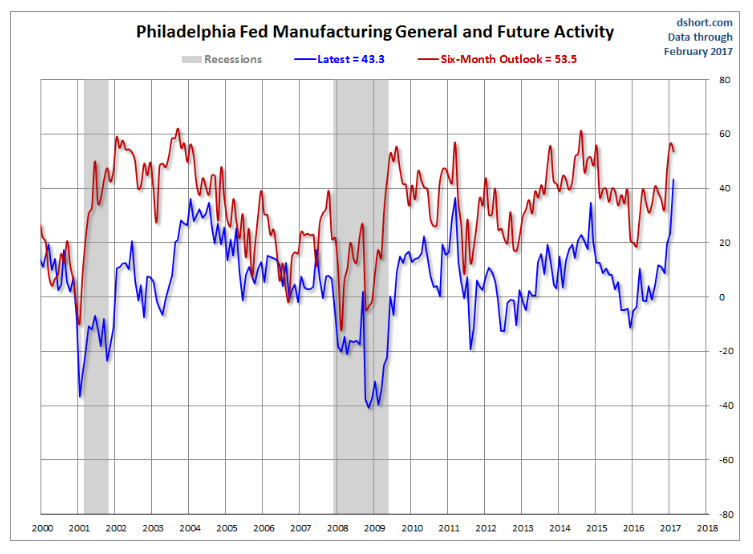
This enigma and divergence implies that one of the two has to give in over the course of the next 10-15 months. As the market is expecting the unfolding of policies (from Asia and Europe, to North and South America) it is rested on positive signals and indicators. Let’s take for example the manufacturing index in the US and its projections. This morning it was reported that the Philly index reached a 33-year high (see graph below).
Such jump is not just historic, but could possibly indicate a GDP growth rate of more than 3.5%. The Empire state index exhibited a similar jump while small business optimism index hit an 11-year high in January. Based on reported earnings and projected sales, year-on-year earnings would fluctuate between 7-9% during the four quarters of this year. Earnings’ growth fuel expectations and the latter could drive the market higher. Therefore, as production and employment increase and commodity prices stabilize, capital expenditures find their equilibrium which helps projections to stand on firmer ground. As the outlook for growth improves and deflationary expectations decline, pressure is taken away from central banks, and hence the “normalization of rates” (which nations cannot afford) seems real and boosts optimism at a time when uncertainty is rising. The market suffers from myopia (uncertainty) while its presbyopia (volatility) is misleading.
What does that all mean for an investors? For one thing, the declining level of volatility signifies the execution of trading strategies for the short term while an investment strategy should be designed for the long term as the uncertainty picture clears and fundamental problems are addressed.
The Enigma of a Divergence: The Uncertainty Index vs. the Volatility Index
Author : John E. Charalambakis
Date : February 16, 2017
In last week’s commentary we wrote that the earnings, production, and income pictures look good and that the market has legs to make further earnings. The market continued in its upswing mode ignoring the above-average high multiples, but also the rising uncertainty around the world. The first graph below signifies the uncertainty index and its constant increase over the course of the last six months for different regions around the world.
Under normal circumstance a rising level of uncertainty regarding economic fundamentals, as well as policy design and execution should be accompanied by a rising level of market volatility. However, as the second graph below shows, the volatility index continues dropping signifying a confident market that can (rightly) ignore noise. The problem is that the markets seem to ignore also the risk of not knowing where policy is going and how it is being planned and executed.
This enigma and divergence implies that one of the two has to give in over the course of the next 10-15 months. As the market is expecting the unfolding of policies (from Asia and Europe, to North and South America) it is rested on positive signals and indicators. Let’s take for example the manufacturing index in the US and its projections. This morning it was reported that the Philly index reached a 33-year high (see graph below).
Such jump is not just historic, but could possibly indicate a GDP growth rate of more than 3.5%. The Empire state index exhibited a similar jump while small business optimism index hit an 11-year high in January. Based on reported earnings and projected sales, year-on-year earnings would fluctuate between 7-9% during the four quarters of this year. Earnings’ growth fuel expectations and the latter could drive the market higher. Therefore, as production and employment increase and commodity prices stabilize, capital expenditures find their equilibrium which helps projections to stand on firmer ground. As the outlook for growth improves and deflationary expectations decline, pressure is taken away from central banks, and hence the “normalization of rates” (which nations cannot afford) seems real and boosts optimism at a time when uncertainty is rising. The market suffers from myopia (uncertainty) while its presbyopia (volatility) is misleading.
What does that all mean for an investors? For one thing, the declining level of volatility signifies the execution of trading strategies for the short term while an investment strategy should be designed for the long term as the uncertainty picture clears and fundamental problems are addressed.