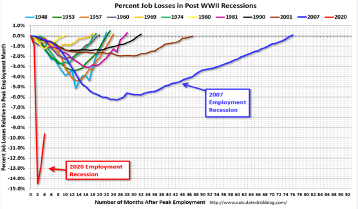
When we look at US jobs data, we get a clear picture that more than 7 out of the 22 million jobs lost during the Covid-19 crisis have been recovered. That fact by itself is a powerful factor in explaining the market’s recovery. However, the surge of infections witnessed in the last few weeks have caused renewed lockdowns and the re-imposing of restrictions, which by default slow down economic activity. The latest data show that we may be facing a levelling off in economic activity, with hints that the depression-like unemployment rate may last longer than anticipated. The following figure, that compares the hit on unemployment (which is the underestimated rate, i.e. the U3 vs. the U6) due to Covid-19 relative to previous recessions, is revealing of the depth of the crisis.
There are concerns that the weakness observed in economic data may be morphing into a sustained pattern given that the fiscal support measures that also contributed to the rebound are fading, and some are expiring soon. Of course, the lingering question is why the equities markets keep going up in the midst of rising infections. The answer to this question has at least four aspects:
- The pace of the recovery and the expectations that it is sustainable.
- The liquidity made available by monetary and fiscal measures.
- The containment seen by countries outside the US.
- The expectations that more support (fiscal and monetary) is on the way.
There is little doubt that indicators seen in the last few weeks (from housing data, to consumer confidence, to business activity, to traffic data, to manufacturing and service data, etc.) point to a recovery. However, there are also clear indications since last week that economic progress is stalling, providing evidence that the pace of the recovery is inexorably tied to the success of fighting the virus. So far, the upbeat data seem to be shaking off concerns over rising infection cases, and the apparent “synchronization” of global markets on Monday (following the Chinese state official boost/endorsement for equities) pushed up the risk appetite with little concern for fundamentals. While we can understand the unleashing of an “animal spirit”, especially when supported by states and central banks, we caution our clients and friends to listen to sound medical voices which remind us that premature celebrations and similar exuberance was also witnessed in prior times and that it did not end well (summer 2015).
Moreover, analysts from several institutions are revising up the negative effects of the crisis, by downgrading economic growth prospects for the rest of the year for most of the countries around the world. For example, the GDP contraction is estimated now to range between 4.3-4.8% in the US, and between 7.4-9.6% for the EU. Furthermore, prosperity bought on credit is not real prosperity. The fact that global debt is projected to increase to over $200 trillion this year, is simply mind boggling.
As global indebtedness rises, so does the need for higher liquidity and extremely loose monetary policy. That liquidity is partially channeled to debt and equity markets and we have the phenomenon where central banks provide liquidity to firms to buy their own stocks! Something is convoluted and rotten. The central banks’ operations do not support the real economy, and historically when the financial economy is separated from the real economy in a significant way, the end-result is not pleasant for anyone. The graph below is indicative of the rising levels of liquidity which – given the financial repression of zero and negative rates – consequently leaks into equities.
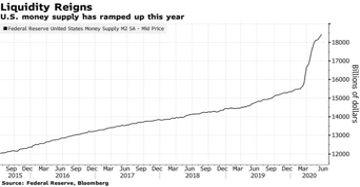
As money creation is accelerating at the fastest rate seen over several decades (by over $3 trillion this year alone as shown above), the probability of leakage into the consumer prices within 18 months is pretty high. Such leakage may be taking place at a time when 170 countries (more than 90% of the world) will be experiencing lower income this year and there are good chances that the global GDP by the end of 2021 will be lower than where it was at the end of 2019. An uncontained pandemic with so much liquidity may be destined to create dislocations that we cannot predict at this point.
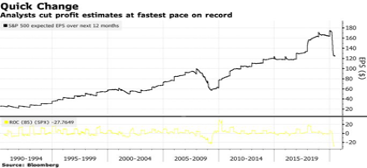
In an environment where stocks gain trillions of dollars in value (somewhere between $8.7-10 trillion) at a time when more than 80% of companies refuse to provide an earnings guidance, and with valuations – despite zero rates – at record highs for decades now (the S&P 500 seems to be trading at about 24 forward earnings when the historically adjusted – for interest rates – multiple is about 19), we reiterate our caution that the enigma of a 20%+ drop in earnings (see graph below), cannot be explained within a puzzle of a riddle that seeks answers in the conundrum of unrealistic expectations.