
“Rule No. 1: Never lose money. Rule No. 2: Never forget rule No.1” – Warren Buffet
“Simplicity is the ultimate sophistication.” – Leonardo da Vinci
The Price-to-Earnings Ratio is probably the most common shorthand methodology used by commentators and practitioners for assessing a company or stock’s valuation. After all, companies are in the businesses of maximizing earnings per share and we’ve all heard how it’s better over the long run to pay less for those earnings, whether it’s from the disciples of Buffett or the mainstream press. As a result, it’s a common exercise for investors and analysts to skim down a list of stocks and their P/E ratios and choose the cheapest one, with the occasional adjustment for growth or balance sheet disparities. Buy the cheaper stock, hold for the long-term, reap profits and then wash, rinse, repeat. If only things were so simple.
The above process is, quite simply, meaningless, for lack of a better term, and doesn’t contain any sort of economic assessment of a business. There’s no consideration as to the quality of the business, its sustainability, its outlook for reinvestment and intrinsic growth, among other shortcomings. To understand why, we revisit and expand upon the topic of Return on Invested Capital (ROIC) with the assistance of work done by Epoch Investment Partners.
At the end of the day, buying a business is laying out capital today for a stream of cash flows in the future. More specifically, whatever cash a business generates in a given year, and is not needed for reinvestment, is available to be distributed to shareholders. Of course, those cash flows are in the future and they must be discounted somewhat in order to represent the time value of money and opportunity costs but the principle remains. Assuming those cash flows grow at some rate in the future, their value can be calculated using the Gordon Growth Model:
P=CF/(r-g)
Where CF = Cash Flow, r = the discount rate/cost of capital (around 9% historically) and g = the rate at which those cash flows grow.
Most investment analysis obsesses over the value of r and g in the above model and not enough on cash flow. More specifically, there is a shortage of consideration as to why cash flows are what they are for a business. The answer, as we’ve described previously, comes down to ROIC.
Consider the following hypothetical example of two companies (we use earnings since we’re investigating the P/E ratio but the concept remains the same with cash flow).

What would a fair valuation be? Conventional analysis would suggest that the price/valuation of these two companies should be identical. If they represent similar risk as the overall market we may say they should trade at 17x Earnings (the median P/E multiple over the last 50 years per Ned Davis Research) or $17 each. After all, if they compete in the same industry they’re exposed to similar amounts of risk and they have the same earnings level and are growing at the same rate. Why would it be any different?
Consider Company A. For every dollar it invests, it gets a 20% return. So in order to grow its earnings by 6%, as stated above, Company A must invest 30% of its current earnings (a 20% return on 30% of its earnings would yield an additional 6% in profit). Company B however would need to invest 60% of its earnings to achieve the same level of growth.
Why does this matter? Because a company is only worth the cash it can distribute to its owners. Company A has 70% of its earnings it can give to shareholders after the 30% investment (or $0.70). Company B can only distribute 40%, or $0.40. Fair value then is as simple as:
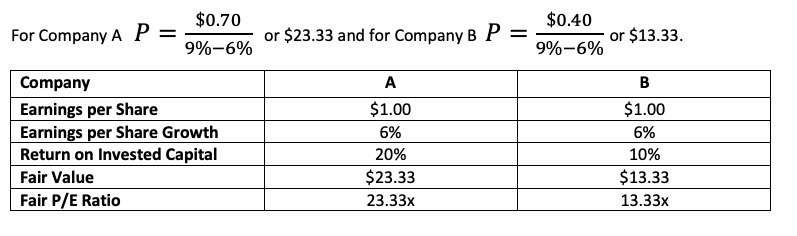
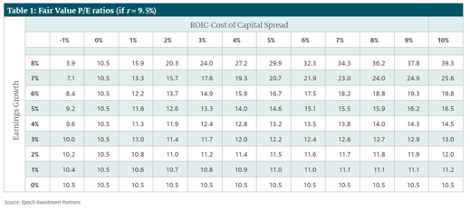
Given the $1 in Earnings we can easily calculate what a fair P/E ratio would be for these two businesses and we can see they are nowhere close to similar and nor should they be. That’s the significance of Return on Invested Capital. Higher levels of ROIC mean that companies, for a given level of growth, will have greater amounts of cash flow at the disposal of their owners. More importantly, relying on P/E ratios to tell you anything about how “cheap” an investment may be is unfounded; any analysis or investment process that divorces P/E ratios from the underlying characteristics of a business is a fool’s game. The P/E ratio should be a product of the fundamental drivers of a firm’s profitability, not an entity unto itself. Figure 1 lays out what fair multiples would be for businesses growing at varying rates and levels of ROIC.
Figure 1: Fair Value P/E Ratios (Epoch Investment Partners)
Astute observers will note that growth and cash flows are not independent of each other. Raising the growth rate means less cash will be available for distribution. The inverse is also true: maximizing cash flow today sacrifices the investments necessary to grow into the future. So which effect wins out?
The answer lies in whether or not that marginal/incremental capital invested (and thus not distributed) is made to earn returns above the cost of capital (denoted by r in our model).
Consider the firm that is not attempting to grow earnings and has an ROIC of 8%. With no efforts at growing, the firm distributes the entirety of its earnings and can be valued at $11.11 ($1÷9%). Now, assume a scenario where it decides to grow earnings by 1%. Its value actually decreases because in order to grow it must invest 12.5% of its earnings. Thus it only has $0.88 to distribute and is worth $11 ($0.88 ÷ (9%-1%)). It has taken a dollar and invested it in unproductive efforts, turning it into ninety cents.
This is how to interpret the quote by Buffet to open this piece, and understand risk more broadly. While risk is conventionally represented in mathematical models by volatility (the deviations in price) a stock may experience, it is better thought of in terms of the potential for permanent capital loss. Malinvestment and decaying returns are the chief culprits of risking capital loss.
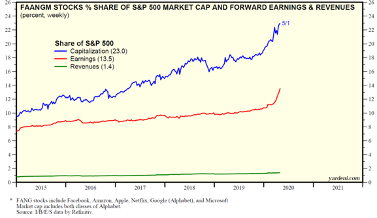
Stepping back, what inspired this little exercise is the stream of logic present today surrounding the famous (or infamous) FAANG stocks (Facebook, Apple, Netflix and Google although Microsoft should be added to the list). One anecdote making the rounds in investment circles as a certain sign of the overvalued status of the market is the fact that these 5 stocks make up more than 20% of the S&P 500’s market capitalization, a record high, and yet only 13% of its earnings.
Figure 2: Market Cap Weighting of Top 5 Stocks

Figure 3: FAANGM % of S&P 500 Earnings and Revenues (Yardeni Research)
Yet when viewed from a Free Cash Flow basis the “overvaluation” essentially disappears.
Figure 4: Free Cash Flow of FAAMG
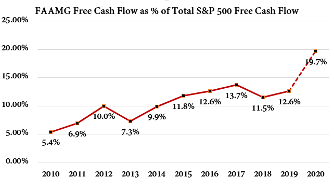
With the exception of Netflix, the 6 businesses cited above do not make the case that the market is overvalued (other factors do, but that’s not the focus here). Moreover, the divergence between their cash generation and earnings speak once again to the role Return on Invested Capital plays in valuation and how shorthand valuation techniques and investment analysis does harm and creates myopia in general. They possessed all the characteristics we’ve mentioned above: high returns on invested capital, a moat to protect those returns, plentiful opportunities to reinvest earnings and grow, and favorable valuations relative to their internal intrinsic worth.
Consider Apple. At the end of 2005 it produced slightly more than $2 billion in Free Cash Flow. In 2019, it produced more than $69B, a compounded annual growth rate of 27%, and its average ROIC was 28%. Compared to the table in Figure 1, characteristics like that are off the chart. And yet, it traded only slightly above the S&P 500 on a P/E basis. Never would Apple have gotten through a filter of the cheapest stocks based on its P/E but based on its economics it could not have been considered anything other than a value stock (Figure 5).
Are we sure there is such a thing as efficient markets?
Figure 5: Apple’s ROIC and Average P/E for the Last 15 Years

On average the S&P 500 has traded at a FCF Yield of 4% and grown about 5% per year for a total return of 9% (hence the 9% cost of capital used in the model earlier). That’s the benchmark for a typical large cap stock and by almost any measure this group of names far surpassed “typical” characteristics*. But if one didn’t have a lens of understanding how ROIC and growth/reinvestment opportunities are the chief value drivers of a business, and thus its stock, money was left on the table. Of course, the earlier model for understanding stocks is a bit simplistic (growth is not constant forever, risks come and go, investment opportunities run out, management changes may usher in poor allocators of capital, etc.) but the underlying principles are iron clad. Moreover, its simplicity allows for focus on real signals of value creation rather than obsessing over the cacophony of information and data available.
*Note: (This is not to be confused as a forward looking, bullish argument for the FAANGM names. In fact, we’d recommend readers take a close look at an analysis of these companies conducted by Semper Augustus here concerning those companies and their poor outlook over the next 10 years.)