I think we are all puzzled by the fact that despite the pumping of credit via monetary reserves in several western nations, we still feel that stagnation prevails and certainly growth is not optimal. At the same time we are still wondering why we have experienced so many bubbles in the era of elastic money i.e. since 1971. Why isn’t the economy growing at a faster pace given the unprecedented expansionary measures? (especially the monetary ones). In the following theoretical analysis, I will attempt to discuss briefly a framework that encompasses both the monetary measures as well as the aggregate demand side of the economy.
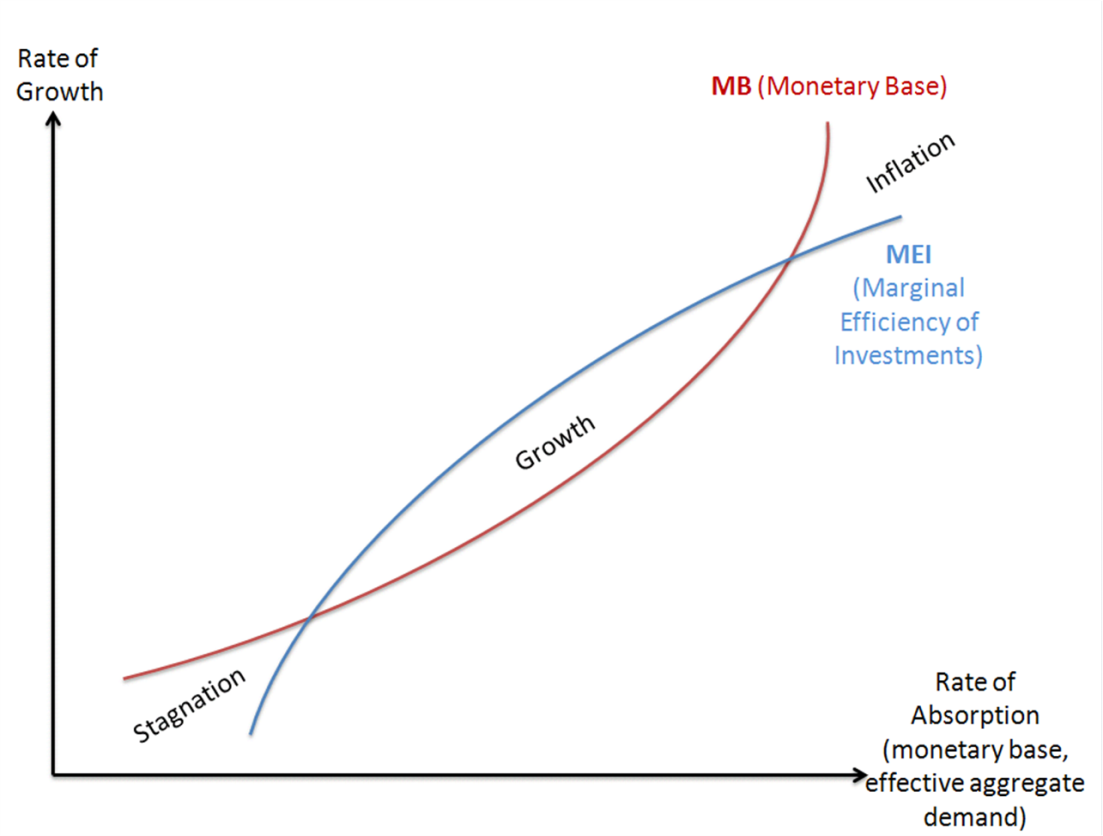
We can define monetary absorption within an income framework the effective rate/ability of the economy to absorb the monetary base (MB=currency + reserves) and convert it into real money supply (given the inflationary constraints/targets of the central bank), along with its ability to generate effective aggregate demand. We can also define MEI as the marginal efficiency of investment a.k.a. rate of return of capital investments. In the theoretical graphs below, the rate of growth (vertical axis) reflects the rate of growth of the MB and of the MEI. (It should be noted that these graphs at periods may change shape e.g. resemble a backward bending curve if e.g. we are in a period of deflation.
I expect this year to be a good year for the equity markets and the economy – as documented in the commentaries back in December – i.e. I expect the GDP growth rate to exceed the pronounced expectations of just a couple of months ago, because we are entering a period where the growth rate of the MEI will exceed the growth rate of the MB, as shown below.
Up to this point (in the post bubble era since 2007) the growth rate of the MB exceeded the growth rate of MEI and the economy felt like being trapped into stagnation. It should be noted that I consider the growth rate of the MB as a proxy of the growth rate of collateralization and securitization, and thus as a proxy for the overall growth in the demand for credit (and thus in this framework the growth rate of the MB is not necessarily exogenous).
When the economy experiences a shock (internal such as a financial crisis, or external such an oil crisis due to monetary disturbances e.g. the closing of the gold window in 1971) the MEI falls below the growth rate of the MB and thus stagnation and/or inflation occurs. The era of growth is the era when the growth rate of the MEI exceeds the growth rate of the MB. I believe that in the US we have entered into that period which justifies capital investments as well as greater allocations into equities. At this stage, we cannot predict for how long this period will last – given its diminishing returns – but when we consider the unfunded liabilities, the amount of debt accumulated, the derivatives exposure, and the shaky EU structure, we could say that unless out-of-the-box solutions are found, this period may end with a bang that would involve an inferno unlike any other in economic history.
If indeed we have entered a period of time (possibly with artificial means) when the growth rate of the MEI starts exceeding the growth of the MB, then the economy will experience growth rates that will approach full potential, and the markets will experience good returns. However, as the graph above shows, the progression of things point to a period of growth until when the growth rate of the MB will start exceeding again the growth rate of the MEI, however this time the crossing is from the opposite direction which could be the period of money collapse via an inferno of high inflation, possibly because the monetary base has been absorbed at high rates and has become money supply, thus unless very strict monetary measures are taken, elastic money (issued at will and without any underlying anchor) will lose its value due to high inflation.
Therefore, while we may be facing a temporary market correction, the estimate is that based on the model above the economy overall and the markets in general should experience a good year.
I will try in the near future to use the same model to explain how periods of bubbles and deflation are created. At this point it may suffice to say that during these periods the two curves fail to intersect and that failure may be the main cause of malinvestments, capital misallocation, and asymmetric risks that fool market participants.
An Attempt to Explain Stagnation, Growth, and Inflationary Episodes in the Post Bretton Woods II Era: The Absorption Framework
Author : John E. Charalambakis
Date : April 2, 2013
I think we are all puzzled by the fact that despite the pumping of credit via monetary reserves in several western nations, we still feel that stagnation prevails and certainly growth is not optimal. At the same time we are still wondering why we have experienced so many bubbles in the era of elastic money i.e. since 1971. Why isn’t the economy growing at a faster pace given the unprecedented expansionary measures? (especially the monetary ones). In the following theoretical analysis, I will attempt to discuss briefly a framework that encompasses both the monetary measures as well as the aggregate demand side of the economy.
We can define monetary absorption within an income framework the effective rate/ability of the economy to absorb the monetary base (MB=currency + reserves) and convert it into real money supply (given the inflationary constraints/targets of the central bank), along with its ability to generate effective aggregate demand. We can also define MEI as the marginal efficiency of investment a.k.a. rate of return of capital investments. In the theoretical graphs below, the rate of growth (vertical axis) reflects the rate of growth of the MB and of the MEI. (It should be noted that these graphs at periods may change shape e.g. resemble a backward bending curve if e.g. we are in a period of deflation.
I expect this year to be a good year for the equity markets and the economy – as documented in the commentaries back in December – i.e. I expect the GDP growth rate to exceed the pronounced expectations of just a couple of months ago, because we are entering a period where the growth rate of the MEI will exceed the growth rate of the MB, as shown below.
Up to this point (in the post bubble era since 2007) the growth rate of the MB exceeded the growth rate of MEI and the economy felt like being trapped into stagnation. It should be noted that I consider the growth rate of the MB as a proxy of the growth rate of collateralization and securitization, and thus as a proxy for the overall growth in the demand for credit (and thus in this framework the growth rate of the MB is not necessarily exogenous).
When the economy experiences a shock (internal such as a financial crisis, or external such an oil crisis due to monetary disturbances e.g. the closing of the gold window in 1971) the MEI falls below the growth rate of the MB and thus stagnation and/or inflation occurs. The era of growth is the era when the growth rate of the MEI exceeds the growth rate of the MB. I believe that in the US we have entered into that period which justifies capital investments as well as greater allocations into equities. At this stage, we cannot predict for how long this period will last – given its diminishing returns – but when we consider the unfunded liabilities, the amount of debt accumulated, the derivatives exposure, and the shaky EU structure, we could say that unless out-of-the-box solutions are found, this period may end with a bang that would involve an inferno unlike any other in economic history.
If indeed we have entered a period of time (possibly with artificial means) when the growth rate of the MEI starts exceeding the growth of the MB, then the economy will experience growth rates that will approach full potential, and the markets will experience good returns. However, as the graph above shows, the progression of things point to a period of growth until when the growth rate of the MB will start exceeding again the growth rate of the MEI, however this time the crossing is from the opposite direction which could be the period of money collapse via an inferno of high inflation, possibly because the monetary base has been absorbed at high rates and has become money supply, thus unless very strict monetary measures are taken, elastic money (issued at will and without any underlying anchor) will lose its value due to high inflation.
Therefore, while we may be facing a temporary market correction, the estimate is that based on the model above the economy overall and the markets in general should experience a good year.
I will try in the near future to use the same model to explain how periods of bubbles and deflation are created. At this point it may suffice to say that during these periods the two curves fail to intersect and that failure may be the main cause of malinvestments, capital misallocation, and asymmetric risks that fool market participants.