
This commentary (unusually longer than normal due to the circumstances) has three distinct parts: An update with our economic and market assessment, a brief presentation of graphs that portray economic trends, and a brief discussion about issues related to economic and market effects.
Part I: Our Assessment
Over the weekend prognostications about a depression proliferated. We reiterate here what we conveyed to our clients on March 12th. The probability of an economic depression is very small. By definition, a depression implies a long-lasting recession. All prognosticators imply that within 6-12 months economic activity will be pretty much normal, therefore by definition we cannot have a depression. Moreover, depression requires the collapse of financial institutions and the fact is that despite the fact that the financial stress index has increased, it remains subdued and below threshold levels. US financial institutions have the strength to overcome the pressures imposed by this crisis. Our concern is with some Japanese and EU-based institutions whose problems may impose collateral damages to US-based financial institutions.
In our email to clients on March 12th, we expressed the opinion that a recession is imminent and its probability exceeded 85% (giving depression a probability of 6%). In the last few days, we read reports from Morgan Stanley, Bank of America, Goldman Sachs, Credit Swiss and others predicting a Q2 drop between 10 and 30 percent. The corresponding unemployment rate is projected to be between 7-14%. We also read James Bullard’s estimates (President of the St. Louis Fed) about a possible drop of the GDP by 50% (on an annualized basis, i.e. a Q2 drop of 12.5% represents a 50% annualized drop). Our opinion is that we are already in a recession and the GDP will drop by between 23-33% (on an annualized rate) in Q2.
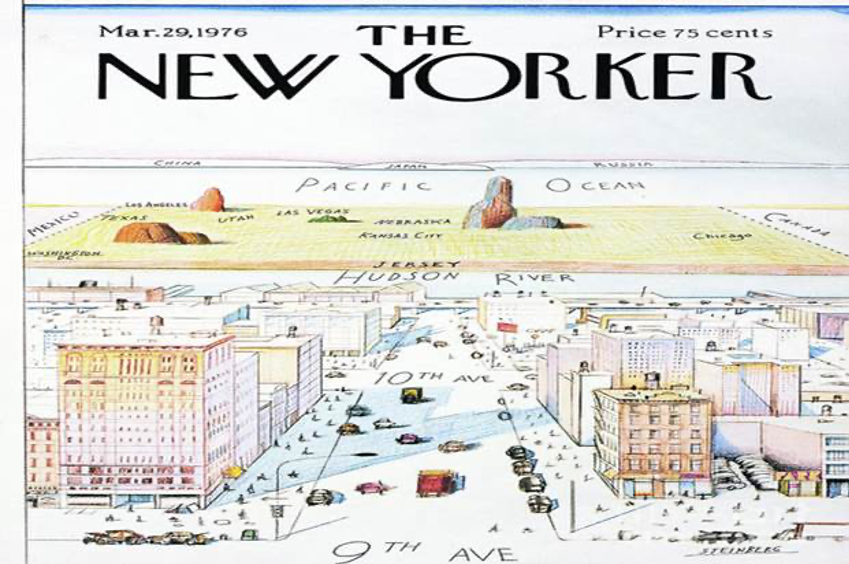
However, calls for an impeding catastrophe suffer from a truncated vision filled with misconceptions. It reminds us of the cover in the New Yorker magazine on March 29, 1976 (see below). Looking west from 9th Avenue, the distance to 11th Avenue (two blocks away) is about as far as from 11th Avenue to Chicago, which appears to be just halfway to Japan! Under such a view, indeed depression is knocking at our door! The truncated vision (caused by the compression and exclusion) makes us believe that catastrophe and depression are already upon us, while the reality is different.
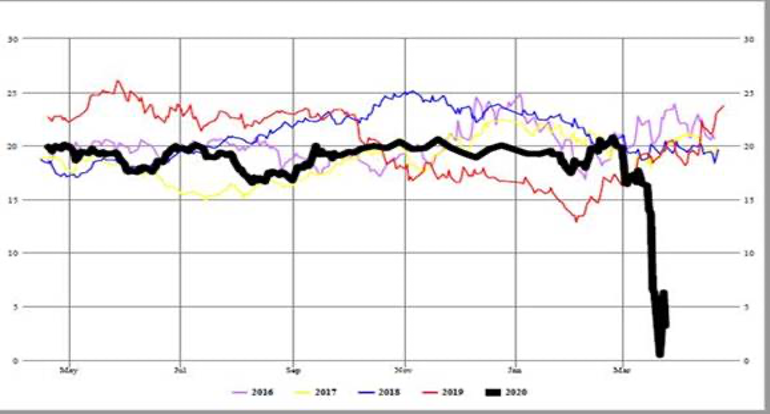
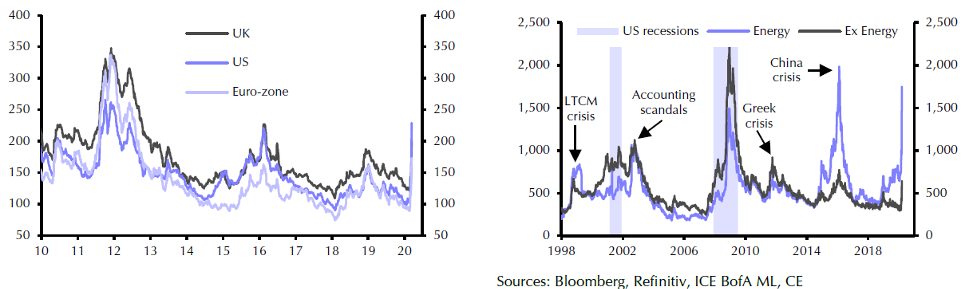
At this point let us share with you the image of the crack spread which portrays a temporary collapse in economic activity. The crack spread represents the profit margin of refineries (the difference between what they sell a gallon of gasoline and the equivalent cost of their input which is crude oil). The crack spread is a good leading economic indicator. The May 2020 Gasoline Crack as shown below and produced by our own platform is still dismal as it can be seen below. Its implications for growth, earnings, employment, and of course equities’ valuation are significant.
On March 12th (when the S&P 500 stood at 2,480), we conveyed to our clients that the S&P 500 may have another 10% to drop, implying that we expected it to start stabilizing at around 2200, assuming that such a drop will be orderly and spread over several days during which there will be some days with gains. Since then it has lost another 9% (standing at the close today at 2237), but in disorderly and very volatile sessions. If such disorderly trading continues, then under the current circumstances the level of 2,200 will be tested. The support level for the S&P 500 will depend upon three things, namely: the drop in corporate earnings, liquidity and access to capital for the next 100 days, and reasonable reactions that avoid further panic.
If corporate earnings drop by about 25%, i.e. from about $160/share to about $120/share (year-on-year), then using a multiple between 16 and 17 we get a figure for the S&P 500 between 1920 and 2040. It seems that the Fed is implementing measures that would support liquidity and access to capital. In addition, forthcoming fiscal measures will also help. As for the reaction, we hope for reason to prevail.
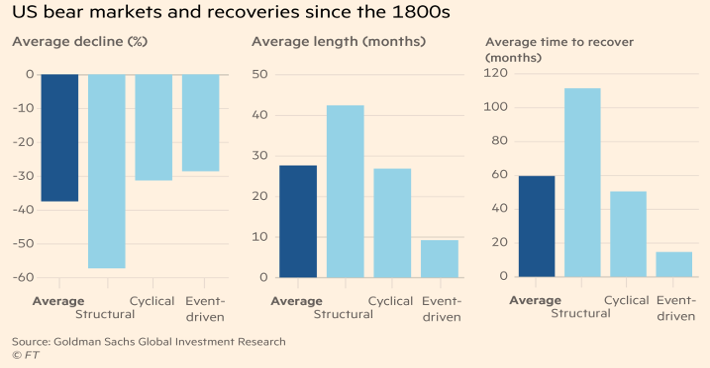
The good news is (see last figure in Part II of this commentary) that market collapses driven by exogenous events usually experience recovery to their previous levels within 18 months.
Part II: Trends
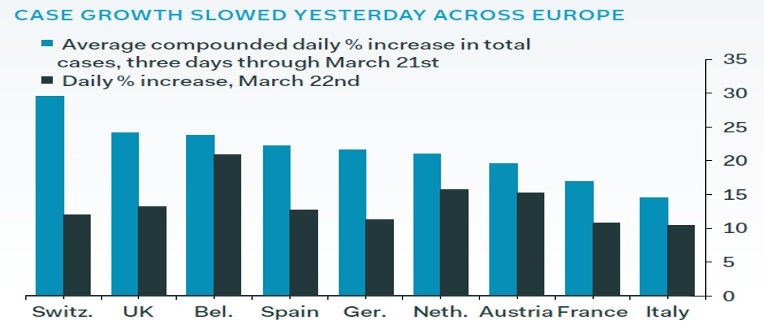
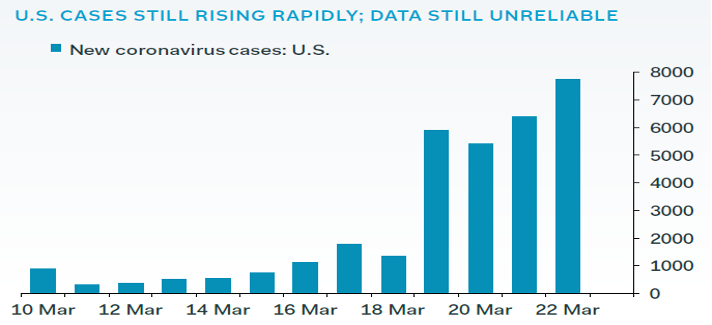
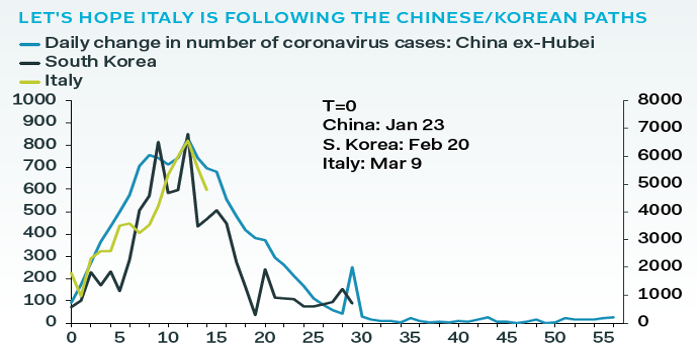
The growth rate of infections seems to be slowing down in Europe, as shown below, but unfortunately, we cannot say the same for the US yet.
The market for commercial real estate mortgage loans is experiencing significant pressure. Mortgage REITs, non-bank lenders and some banks are already feeling the pain. The fact that the Fed is pledging enough liquidity should relieve some pressure especially from banks. Some well-known names lost more than 30% of their values last week.
In advanced economies financial conditions are getting tighter. However, this is due to an exogenous shock now and have nothing to do with endogenous causes like in the 2008 crisis. Therefore, financial stress is posing less of a headwind now. That being said, authorities (the Fed and federal governments) cannot allow a liquidity crunch to morph into a systemic financial crisis or into a solvency crisis.
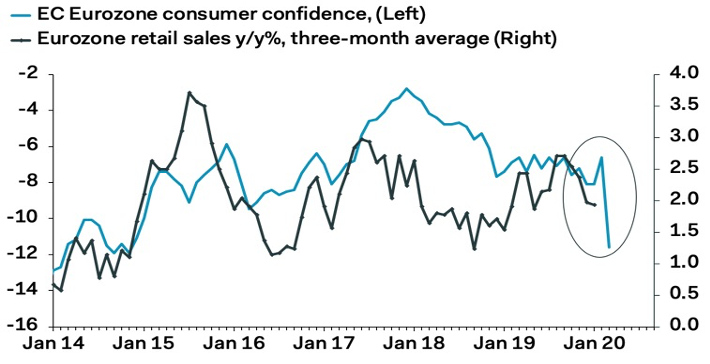
On the consumer front, the data released today show the first negative effects of Covid-19 on the Europeans’ consumer sentiment, as shown below. Unfortunately, the worst is to come, and today’s PMI data are expected to be pretty grim.
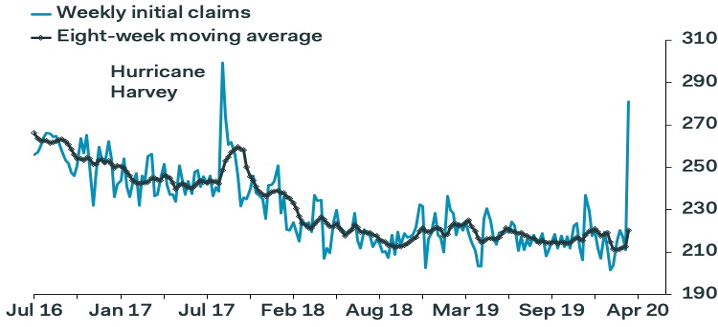
On the unemployment side in the US, the weekly claims increased substantially and will be getting much worse.
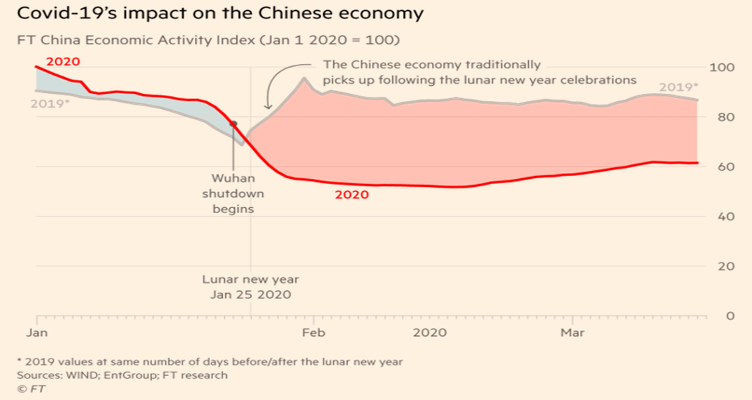
The impact on the Chinese economy can be seen below and could be summarized by stating that the GDP growth rate (assuming that we can trust the forthcoming numbers) would be dismal.
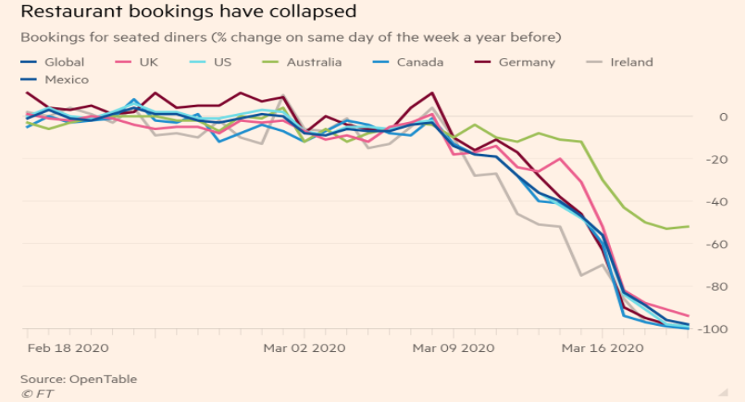
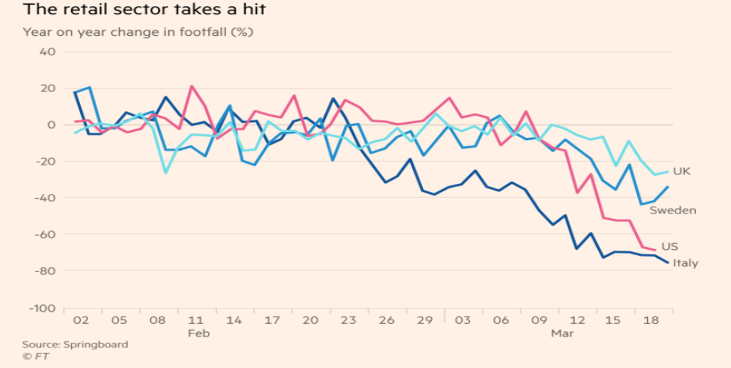
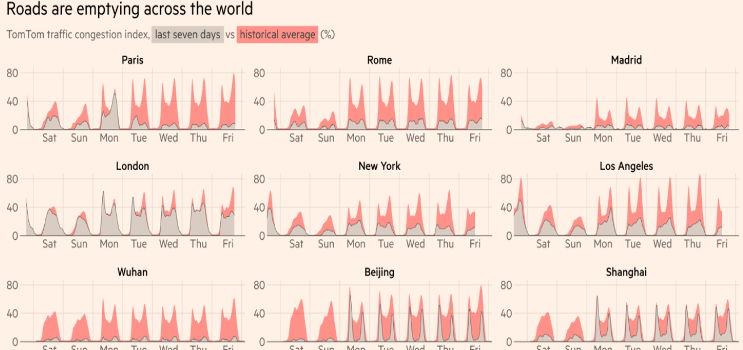
Around the world restaurant bookings have completely collapsed, the retail sector is suffering (hence the commercial real estate earthquakes mentioned above), while traffic has also dropped significantly, as shown below.
And now a bit of good news. Historically speaking an event-driven market crash (like the one we are experiencing) leads to a bear market that lasts less than a year and takes less than 18 months for the market to recover to its previous levels (see graph below).
Part III: Economic Effects
The Fed’s actions from last week, as well as the announcements made on Sunday and yesterday, imply that the central bank will be monetizing the whole fiscal package to be passed by Congress, as well as backstopping public debt (including munis), money markets and possibly some private debt markets too. The establishment of facilities to support primary and secondary investment-grade bond markets will add sufficient liquidity to alleviate stresses. The Primary Market Commercial Credit Facility will become the bridge facility for four years. The new Asset-backed Securities Loan Facility will eventually become the backstop for student loans, auto loans, credit card loans, etc. The “Main Street Business Lending Program” will become the lending arm to support small and medium-size businesses.
We believe that the fire sale of safe-haven assets (such as Treasuries and gold) was done out of panic and due to the need to raise cash. We expect both of them to stabilize. The concerns that are rising about deflation due to the collapse in economic activity are certainly valid. The deflationary forces at work make real interest rates (the difference between nominal rates and the negative inflation) rise and that may have contributed to the sale of safe-haven assets. However, the monetization measures by the Fed should counter-balance those deflationary threats and may even nudge inflationary pressures, in which case precious metals may tend to go higher (we got a glimpse of that yesterday when gold prices increased by more than 4%). It’s a bit premature to talk about inflationary measures, but our concern is that what the Fed started last fall with repos (which increased substantially in the last few days) will end up increasing the money supply and not just the monetary base. Our concern is that the road this might come back as a boomerang to shake up and undermine the bond markets.
The recent dollar strength was boosted by concerns regarding dollar funding in countries outside the US. However, the swap lines that the Fed established with other central banks should ease the funding pressures, and hence we expect the dollar’s upswing to cease and the dollar possibly to give up some of its recent gains. Furthermore, as the pandemic is brought under control commodity currencies (of the countries whose fortunes are tied to commodities) should bounce back.
The recent spikes in lending spreads (such as LIBOR/TB spread), or the spikes in investment-grade yields (graph on the left) as well as high yield bonds (graph on the right below), are expected to ease due to Fed’s actions and even more later when the virus effects start fading.
What is happening is truly heartbreaking. The infections, the deaths, the furloughs, the rising unemployment, the inability to design and execute a comprehensive response, the shortages, the declining incomes, the collapse in demand and in economic activity, all paint a dismal picture for families and the nation for the immediate future.
We live through the drafting of a bad chapter in our lives. We choose to believe that it will be a bad chapter in a good book called life, whose aroma will be enhanced not by focusing on the thorns but rather on mastering to rescue the roses.