It is an indisputable fact that the last ten months have been characterized by high volatility. The market breadth (defined as the number of advancing over declining stocks) has turned below one (implying that more stocks declined than advanced) several times during the year and some bearish voices are being heard again recently. We also need to point out that from the start of the year this kind of volatility was expected. We could possibly outline a few reasons for this volatility such as uncertainty about the Fed’s interest rate moves, concerns about global growth, Chinese tremors, and concerns related to the growth of earnings, bond liquidity issues, emerging markets turmoil, declining capital expenditures, stronger dollar, etc.
The claim of this commentary is that given that this brewing volatility stayed within a controllable range, it could become the fertile ground for market tranquility in 2016. We are of the opinion that the ingredients for such tranquility exist in four main areas: First, the Fed most probably will raise rates and will indicate a gradual approach that could be withdrawn and reversed if needed. As we have pointed out before, the higher rates will boost confidence, attract foreign capital, and end the ZIRP policy that creates market distortions. Second, low energy prices will translate into higher consumer spending, something that has not materialized yet but is expected to take place now that the overwhelming sentiment is that low energy prices will prevail in the foreseeable future. Third, other central banks (Japanese, European, and Chinese) will continue following accommodative monetary policies, which in turn will boost asset prices, earnings, spending, and market confidence. Fourth, the higher spending and market confidence will advance earnings and capital spending while concerns that upset the market this year will subside due to perceptions formulated that the economy stands on firmer ground.
Let’s see two graphs related to the volatility we experienced in 2015. The first graph below known as the McClellan Oscillator ranges from +100 to -100 (the value reported is a moving average and a number close to +100 indicates overbought levels).
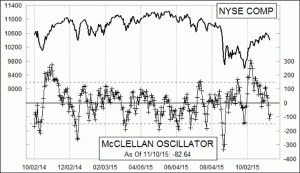
As shown above the number as of the closing of the market on Tuesday November 11th was -82.64, indicating an oversold market, which we consider an indication for a fertile ground.
During the 252 trading days this year, 128 experienced a negative market (S&P 500) while 124 experienced a positive closing. The graph below shows the positive vs. the negative closing of the S&P 500 during the last year.
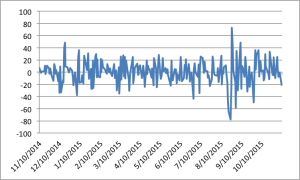
The fact that the number of positive closings is almost equal to the number of negative closings is indicative in our opinion of a P/E ratio waiting to be raised above the current historical average.
A good chunk of the trading volume in the last year is due to corporate buybacks. While this trend may continue, we believe that there are factors in formation (reemerging manufacturing, sales upswing, consumer deleveraging, healthier US banks, credit availability, higher expected incomes, etc.) that will reduce the risks associated with market uncertainties and which in turn will advance the market to higher grounds in the foreseeable future.
The Tranquility of Volatility: The Risk of the Uncertainty and the Pricing of Assets
Author : John E. Charalambakis
Date : November 10, 2015
It is an indisputable fact that the last ten months have been characterized by high volatility. The market breadth (defined as the number of advancing over declining stocks) has turned below one (implying that more stocks declined than advanced) several times during the year and some bearish voices are being heard again recently. We also need to point out that from the start of the year this kind of volatility was expected. We could possibly outline a few reasons for this volatility such as uncertainty about the Fed’s interest rate moves, concerns about global growth, Chinese tremors, and concerns related to the growth of earnings, bond liquidity issues, emerging markets turmoil, declining capital expenditures, stronger dollar, etc.
The claim of this commentary is that given that this brewing volatility stayed within a controllable range, it could become the fertile ground for market tranquility in 2016. We are of the opinion that the ingredients for such tranquility exist in four main areas: First, the Fed most probably will raise rates and will indicate a gradual approach that could be withdrawn and reversed if needed. As we have pointed out before, the higher rates will boost confidence, attract foreign capital, and end the ZIRP policy that creates market distortions. Second, low energy prices will translate into higher consumer spending, something that has not materialized yet but is expected to take place now that the overwhelming sentiment is that low energy prices will prevail in the foreseeable future. Third, other central banks (Japanese, European, and Chinese) will continue following accommodative monetary policies, which in turn will boost asset prices, earnings, spending, and market confidence. Fourth, the higher spending and market confidence will advance earnings and capital spending while concerns that upset the market this year will subside due to perceptions formulated that the economy stands on firmer ground.
Let’s see two graphs related to the volatility we experienced in 2015. The first graph below known as the McClellan Oscillator ranges from +100 to -100 (the value reported is a moving average and a number close to +100 indicates overbought levels).
As shown above the number as of the closing of the market on Tuesday November 11th was -82.64, indicating an oversold market, which we consider an indication for a fertile ground.
During the 252 trading days this year, 128 experienced a negative market (S&P 500) while 124 experienced a positive closing. The graph below shows the positive vs. the negative closing of the S&P 500 during the last year.
The fact that the number of positive closings is almost equal to the number of negative closings is indicative in our opinion of a P/E ratio waiting to be raised above the current historical average.
A good chunk of the trading volume in the last year is due to corporate buybacks. While this trend may continue, we believe that there are factors in formation (reemerging manufacturing, sales upswing, consumer deleveraging, healthier US banks, credit availability, higher expected incomes, etc.) that will reduce the risks associated with market uncertainties and which in turn will advance the market to higher grounds in the foreseeable future.