We have written briefly before (July 2010 commentary) on the dangers of the municipal bond market. In this commentary we make the claim that the housing sector leaves a mark of hysteresis in the municipal bond market, which has already started to exhibit signs of distress. We are of the opinion that the bond market in general is in bubble territory. We would not be surprised if it is the municipal bond market that will play the definitive role that Bear Stearns played in March of 2008 pointing to the impending collapse. Of course there were signs of that collapse starting in the summer of 2007.
While we hold strong on the fact that the housing sector crisis was a symptom of a greater toxic asset cause, we cannot avoid but contemplate the relationship between the housing sector and the municipal bond market. When the former is strong, the spread between municipal bonds and Treasuries narrows, while when the housing sector suffers the spread increases. Moreover, when the housing sector performs well, the relationship between housing prices and the spread is positive. While when the housing market suffers, the relationship turns negative as the following graph shows.
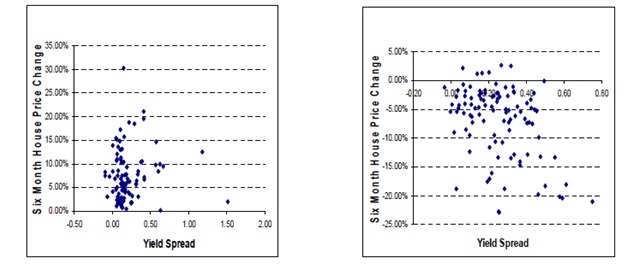
Source: Case-Shiller, Standard & Poor’s, Investor Tools
In addition, the counties that experience greater housing sector declines, also exhibit greater spreads, as the graph below demonstrates.
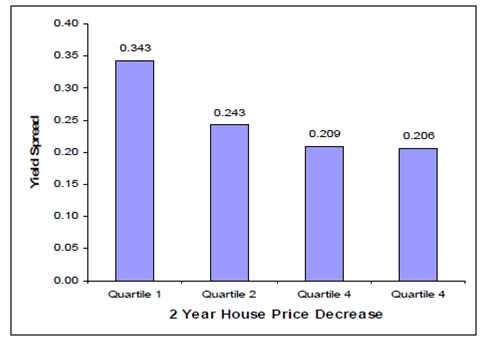
Source: Case-Shiller, Standard & Poor’s.
The depressed housing sector and the rising yields add further pressures to municipal finances and the observed funding gaps. Between 2011-‘12 it is estimated that over $240 billion in funding needs for the municipalities will be observed.
The municipal bond market is approaching the 3 trillion dollar mark. As housing prices remain depressed and the tax coffers cannot be filled (also due to high unemployment and undertaken municipal liabilities), the municipalities will also face the game of musical chairs when federal and state funding ceases later this year. Moreover, there is at least 1 trillion dollars in unfunded pension and health care liabilities. Hence, the funding gaps and the unfunded liabilities may turn out to be the straw that will break the camel’s back and will expose – with a hysteresis of almost three years – the bubble of all bubbles a.k.a. the bond/debt bubble.
According to Moody’s when a default occurs such as a missed interest payment on a municipal bond, the average municipal bond loses more than 30% of its value. When we take into account the new Congress and the anti-bailout sentiment, we could not help it but contemplate a snowball of municipal exodus that will affect every debt issuer. (Let’s clarify that the majority of the munis represent not general obligation bonds , but rather project/revenue bonds, and hence the problems are even worse).
The figure that follows exemplifies the yields on Treasuries and the one on Munis. As it can be seen, the spread increased significantly during the financial crisis and is rising again.
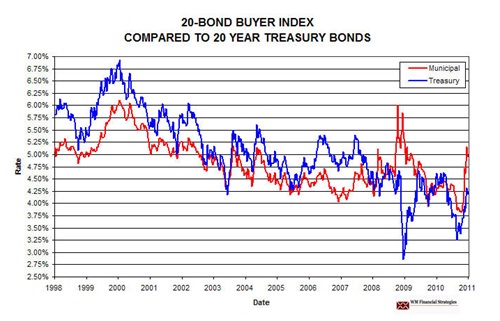
Source: WM Financial Strategies
The rising yield observed in the last three months seems to be a prelude and a thorn to a bad book we may be forced to read in 2011.
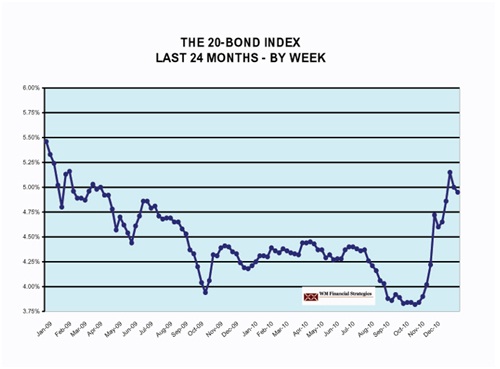
Source: WM Financial Strategies
Ode to those who avoid paper assets!
The Mark of Debt: Hysteresis in Municipal Bonds in the Saga of Bubbles
Author : John E. Charalambakis
Date : January 5, 2011
We have written briefly before (July 2010 commentary) on the dangers of the municipal bond market. In this commentary we make the claim that the housing sector leaves a mark of hysteresis in the municipal bond market, which has already started to exhibit signs of distress. We are of the opinion that the bond market in general is in bubble territory. We would not be surprised if it is the municipal bond market that will play the definitive role that Bear Stearns played in March of 2008 pointing to the impending collapse. Of course there were signs of that collapse starting in the summer of 2007.
While we hold strong on the fact that the housing sector crisis was a symptom of a greater toxic asset cause, we cannot avoid but contemplate the relationship between the housing sector and the municipal bond market. When the former is strong, the spread between municipal bonds and Treasuries narrows, while when the housing sector suffers the spread increases. Moreover, when the housing sector performs well, the relationship between housing prices and the spread is positive. While when the housing market suffers, the relationship turns negative as the following graph shows.
Source: Case-Shiller, Standard & Poor’s, Investor Tools
In addition, the counties that experience greater housing sector declines, also exhibit greater spreads, as the graph below demonstrates.
Source: Case-Shiller, Standard & Poor’s.
The depressed housing sector and the rising yields add further pressures to municipal finances and the observed funding gaps. Between 2011-‘12 it is estimated that over $240 billion in funding needs for the municipalities will be observed.
The municipal bond market is approaching the 3 trillion dollar mark. As housing prices remain depressed and the tax coffers cannot be filled (also due to high unemployment and undertaken municipal liabilities), the municipalities will also face the game of musical chairs when federal and state funding ceases later this year. Moreover, there is at least 1 trillion dollars in unfunded pension and health care liabilities. Hence, the funding gaps and the unfunded liabilities may turn out to be the straw that will break the camel’s back and will expose – with a hysteresis of almost three years – the bubble of all bubbles a.k.a. the bond/debt bubble.
According to Moody’s when a default occurs such as a missed interest payment on a municipal bond, the average municipal bond loses more than 30% of its value. When we take into account the new Congress and the anti-bailout sentiment, we could not help it but contemplate a snowball of municipal exodus that will affect every debt issuer. (Let’s clarify that the majority of the munis represent not general obligation bonds , but rather project/revenue bonds, and hence the problems are even worse).
The figure that follows exemplifies the yields on Treasuries and the one on Munis. As it can be seen, the spread increased significantly during the financial crisis and is rising again.
Source: WM Financial Strategies
The rising yield observed in the last three months seems to be a prelude and a thorn to a bad book we may be forced to read in 2011.
Source: WM Financial Strategies
Ode to those who avoid paper assets!