It has long been our position that the debt market should be viewed as a market for third-party liabilities. Its growth advances leverage and brings with it diminishing returns since more and more funds are needed to produce a dollar of profits and of GDP. The growth of debt makes the credit creation mechanism (see previous commentaries on Strategic Disintegration) unstable, and from that perspective endangers the whole economy with severe recessions and/or periods of anemic growth and successive recessions. The last two decades that the Japanese economy lost affirm such thesis.
Therefore, we consider the increase in yields of the last few days a pretty healthy sign; part of what can be the beginning of a period of controlled disintegration that strategically advances growth prospects through capital and wealth creation which in turn promote real economic growth.
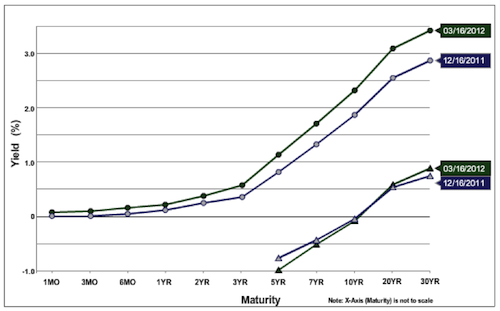
Let’s review the yield picture over the last several months. The first graph below shows us the significant increase in the yield curve since last December. At this stage all Treasuries that mature in less than ten-years have been experiencing negative returns. The ten-year yield has jumped from about 1.95% to 2.31% in three months.

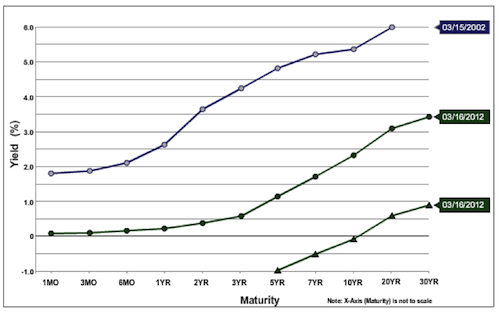
Of course, the yields have a long way to go if we compare them to where they stood ten years ago. The following graph shows us exactly that. When we take into account surfacing sovereign risks, inflation, unfunded liabilities, debt explosion, currency risks in an era of globalization, and geopolitical uncertainties, then to have the ten-year Treasury yielding around 4% (not necessarily the 5.5% of 2002) should be quite normal. Certainly we do not see that such a rate will be reached soon.

The trend reversal in yields may signal a vote of confidence for greater growth prospects – which of course could be derailed by geopolitical events – and an indirect affirmation that market premium will start experiencing a downward trend, implying that equities have room to grow (per our previous writings).
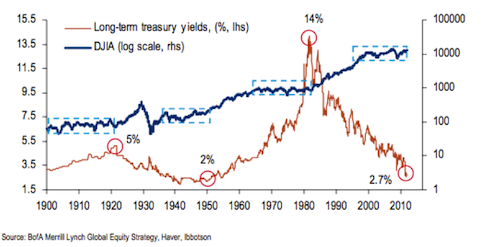
At this point it’s worth pointing out the following: According to the figure below, there are historic periods when the equities markets have been going sideways. An upward trend in the yield’s direction signaled an equities rally during those periods (see dashed boxes in the equities line and circled periods in the yields trend below).

It might be time to start seeing the paper market for what it is: Third-party liability.
Signs of Controlled Disintegration: The Market for Debt, Financial Stability & Prospects for Growth
Author : John E. Charalambakis
Date : March 19, 2012
It has long been our position that the debt market should be viewed as a market for third-party liabilities. Its growth advances leverage and brings with it diminishing returns since more and more funds are needed to produce a dollar of profits and of GDP. The growth of debt makes the credit creation mechanism (see previous commentaries on Strategic Disintegration) unstable, and from that perspective endangers the whole economy with severe recessions and/or periods of anemic growth and successive recessions. The last two decades that the Japanese economy lost affirm such thesis.
Therefore, we consider the increase in yields of the last few days a pretty healthy sign; part of what can be the beginning of a period of controlled disintegration that strategically advances growth prospects through capital and wealth creation which in turn promote real economic growth.
Let’s review the yield picture over the last several months. The first graph below shows us the significant increase in the yield curve since last December. At this stage all Treasuries that mature in less than ten-years have been experiencing negative returns. The ten-year yield has jumped from about 1.95% to 2.31% in three months.
Of course, the yields have a long way to go if we compare them to where they stood ten years ago. The following graph shows us exactly that. When we take into account surfacing sovereign risks, inflation, unfunded liabilities, debt explosion, currency risks in an era of globalization, and geopolitical uncertainties, then to have the ten-year Treasury yielding around 4% (not necessarily the 5.5% of 2002) should be quite normal. Certainly we do not see that such a rate will be reached soon.
The trend reversal in yields may signal a vote of confidence for greater growth prospects – which of course could be derailed by geopolitical events – and an indirect affirmation that market premium will start experiencing a downward trend, implying that equities have room to grow (per our previous writings).
At this point it’s worth pointing out the following: According to the figure below, there are historic periods when the equities markets have been going sideways. An upward trend in the yield’s direction signaled an equities rally during those periods (see dashed boxes in the equities line and circled periods in the yields trend below).
It might be time to start seeing the paper market for what it is: Third-party liability.