Without a doubt in the last three-four months we live an oxymoron: In the midst of the sovereign debt crisis in Europe, the Euro has been strengthening and the US dollar has been weakening, as the following graph shows.
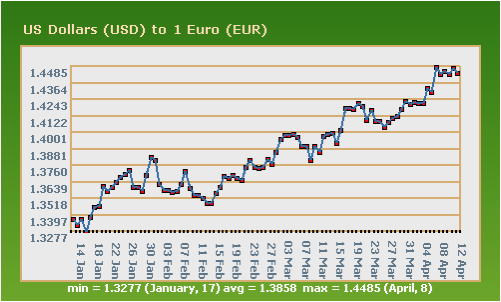
We will let primarily graphs to talk in this commentary, but as an introductory note we could say that it has been a win-win situation for the parties involved. The Eurozone has been suffering from tight liquidity. The US needs to fix its current account balance on its way to full recovery. The QE2 (a.k.a. debt monetization) coincided with an extension of the swap line between our Federal Reserve Bank and the European Central Bank (ECB). Our claim is that the strengthening of the Euro can be partially explained by the swap line, which also advances US interests in the sense of improving the trade balance.
Of course the narrowing of the trade balance takes time, but the results were already evident in February, when the deficit narrowed from $47 billion to $45.8 billion, as the following graph demonstrates.
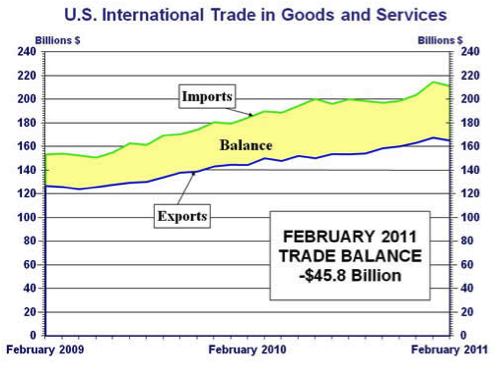
The purchases of Euros by the Fed in a swap agreement, provides liquidity in the EU, while naturally strengthens the currency in demand i.e. the Euro, while weakening – as desired for trade purposes – the USD.
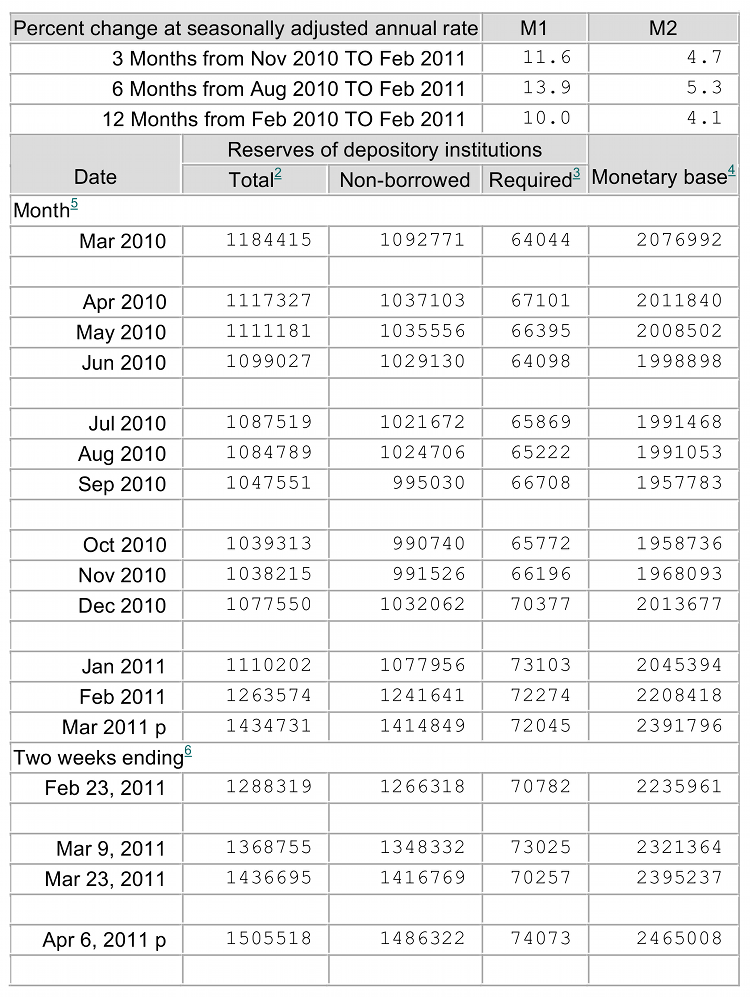
Let’s look at the rate of increase of the monetary base (which is at the core of the swap line rather than the traditional money supply measures of M1 & M2). As the following table shows (taken directly from the Fed’s account) the increase in the monetary base (currency+reserves) between December 2010 and April 6, 2011 is over 22%, while the increase in the traditional M1 has been only 11).
At a time when the Fed has been keeping the borrowing cost almost at zero, the ECB has had higher rates, and last week it increased them by 25 basis points. These actions resulted in declining swap rates (when assets are being swapped) as the following graph shows.
One year USD Swap Rate
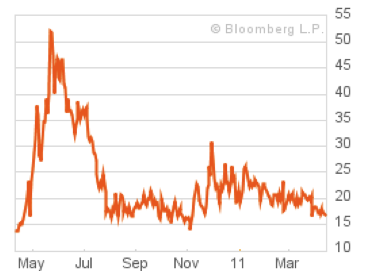
The decline in the USD swap rate contributes to the decline of the LIBOR-OIS spread. A narrowing of that spread signals lower counterparty risk and greater appetite for interbank loans. Hence the objective of unfreezing the interbank loan market – especially among EU banks – could also be achieved through QE2 (please refer to our commentaries last year regarding QE2 here).
The graph below confirms the narrowing of that spread.
LIBOR-OIS Spread
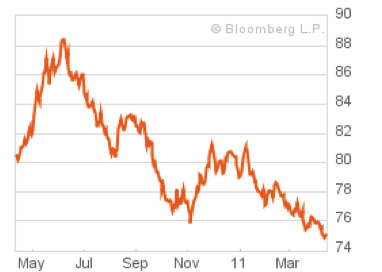
Internationally, the USD experiences further declines (see graph below), which simply boosts US exports while makes US imports more expensive.
USD Index
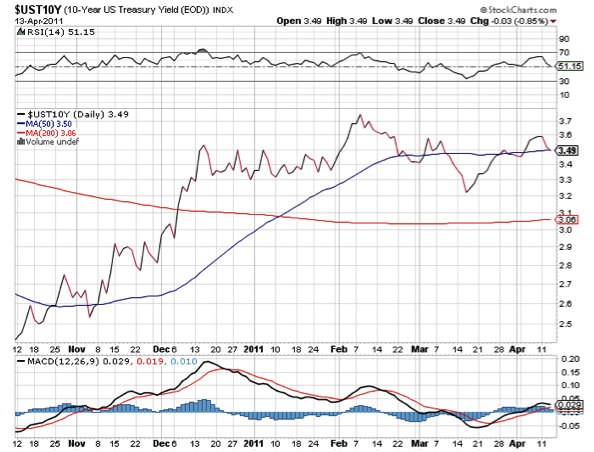
Of course, the cheapening of the currency should have yield consequences. Thus, the 10-year US treasury Note yield has been rising as the following graph shows, but since the US owes its debt in her own currency, in the long-run this has limited consequences, while it boosts fixed income for those who depend on that.
10-Year Note Yield Curve
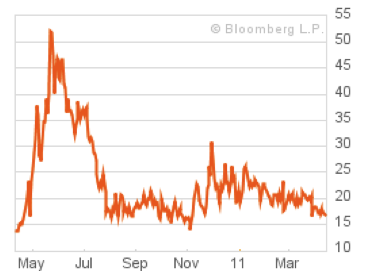
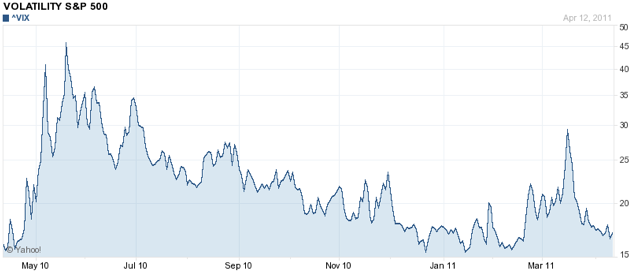
Chairman Bernanke has been using another justification, which says that QE2 has been boosting share prices. With all due respect to the Chairman, we simply cannot accept such rationale. The Fed is not in the business of boosting the stock market. However, if we extended the Chairman’s rationale, we could have claimed that QE2 will reduce market volatility and thus also reduce financial instability. We could certainly applaud the reduction of such volatility, which as the following graph demonstrates, has been achieved.
VIX Index
Let’ s close by stating that we are of the opinion that there are two additional significant forces at work that have also contributed to the weakness of the greenback, namely: Carry trade (borrowing cheaply in USD and investing the proceeds in higher paying EU instruments), and international trade agreements among BRIC countries(let’s not forget that the BRIC countries have been holding a summit in China yesterday and today to which they invited also S. Africa), which call for payments in their respective currencies rather than in USD.
Why do we have paper money without an anchor?
Ode to anchors!
On Euro’s “Strength” and Dollar’s Weakness: The Role of Swaps Among Central Banks
Author : John E. Charalambakis
Date : April 15, 2011
Without a doubt in the last three-four months we live an oxymoron: In the midst of the sovereign debt crisis in Europe, the Euro has been strengthening and the US dollar has been weakening, as the following graph shows.
We will let primarily graphs to talk in this commentary, but as an introductory note we could say that it has been a win-win situation for the parties involved. The Eurozone has been suffering from tight liquidity. The US needs to fix its current account balance on its way to full recovery. The QE2 (a.k.a. debt monetization) coincided with an extension of the swap line between our Federal Reserve Bank and the European Central Bank (ECB). Our claim is that the strengthening of the Euro can be partially explained by the swap line, which also advances US interests in the sense of improving the trade balance.
Of course the narrowing of the trade balance takes time, but the results were already evident in February, when the deficit narrowed from $47 billion to $45.8 billion, as the following graph demonstrates.
The purchases of Euros by the Fed in a swap agreement, provides liquidity in the EU, while naturally strengthens the currency in demand i.e. the Euro, while weakening – as desired for trade purposes – the USD.
Let’s look at the rate of increase of the monetary base (which is at the core of the swap line rather than the traditional money supply measures of M1 & M2). As the following table shows (taken directly from the Fed’s account) the increase in the monetary base (currency+reserves) between December 2010 and April 6, 2011 is over 22%, while the increase in the traditional M1 has been only 11).
At a time when the Fed has been keeping the borrowing cost almost at zero, the ECB has had higher rates, and last week it increased them by 25 basis points. These actions resulted in declining swap rates (when assets are being swapped) as the following graph shows.
One year USD Swap Rate
The decline in the USD swap rate contributes to the decline of the LIBOR-OIS spread. A narrowing of that spread signals lower counterparty risk and greater appetite for interbank loans. Hence the objective of unfreezing the interbank loan market – especially among EU banks – could also be achieved through QE2 (please refer to our commentaries last year regarding QE2 here).
The graph below confirms the narrowing of that spread.
LIBOR-OIS Spread
Internationally, the USD experiences further declines (see graph below), which simply boosts US exports while makes US imports more expensive.
USD Index
Of course, the cheapening of the currency should have yield consequences. Thus, the 10-year US treasury Note yield has been rising as the following graph shows, but since the US owes its debt in her own currency, in the long-run this has limited consequences, while it boosts fixed income for those who depend on that.
10-Year Note Yield Curve
Chairman Bernanke has been using another justification, which says that QE2 has been boosting share prices. With all due respect to the Chairman, we simply cannot accept such rationale. The Fed is not in the business of boosting the stock market. However, if we extended the Chairman’s rationale, we could have claimed that QE2 will reduce market volatility and thus also reduce financial instability. We could certainly applaud the reduction of such volatility, which as the following graph demonstrates, has been achieved.
VIX Index
Let’ s close by stating that we are of the opinion that there are two additional significant forces at work that have also contributed to the weakness of the greenback, namely: Carry trade (borrowing cheaply in USD and investing the proceeds in higher paying EU instruments), and international trade agreements among BRIC countries(let’s not forget that the BRIC countries have been holding a summit in China yesterday and today to which they invited also S. Africa), which call for payments in their respective currencies rather than in USD.
Why do we have paper money without an anchor?
Ode to anchors!